An insight into the GLAMhack2022 by Alessandro Plantera, and
Hackathons
GLAMhack 2022
Alain und Laura sind neue Medien

Two comedians take a poetic journey along selected cultural datasets. They uncover trivia, funny and bizarre facts, and give life to data in a most peculiar way. In French, German, English and some Italian.
Data
- http://www.openstreetmap.org
- http://make.opendata.ch/wiki/data:glam_ch#pcp_inventory
- http://make.opendata.ch/wiki/data:glam_ch#carl_durheim_s_police_photogra...
- http://make.opendata.ch/wiki/data:glam_ch#swiss_book_2001
Team
- Catherine Pugin
- Laura Chaignat
- Alain Guerry
- Dominique Genoud
- Florian Evéquoz
Links
Tools: Knime, Python, D3, sweat, coffee and salmon pasta
Artmap

Simple webpage created to display the art on the map and allow to click on each individual element and to follow the URL link:
Find art around you on a map!
Data
Team
- odi
- julochrobak
- and other team members
catexport

Export Wikimedia Commons categories to your local machine with a convenient web user interface.
Try it here: http://catexport.herokuapp.com
Data
- Wikimedia Commons API
Team
- odi
- and other team members
Related
At #glamhack a number of categories were made available offline by loleg using this shell script and magnus-toolserver.
Cultural Music Radio

This is a cultural music radio which plays suitable music depending on your gps location or travel route. Our backend server looks for artists and musicians nearby the user's location and sends back an array of Spotify music tracks which will then be played on the iOS app.
Server Backend
We use a python server backend to process RESTful API requests. Clients can send their gps location and will receive a list of Spotify tracks which have a connection to this location (e.g. the artist / musician come from there).
Javascript Web Frontend
We provide a javascript web fronted so the services can be used from any browser. The gps location is determined via html5 location services.
iOS App
In our iOS App we get the user's location and send it to our python backend. We then receive a list of Spotify tracks which will be then played via Spotify iOS SDK.
There is also a map available which shows where the user is currently located and what is around him.
We offer a nicely designed user interface which allows users to quickly switch between music and map view to discover both environment and music! ![]()

Data and APIs
-
MusicBrainz for linking locations to artists and music tracks
-
Spotify for music streaming in the iOS app (account required)
Team
Diplomatic Documents and Swiss Newspapers in 1914
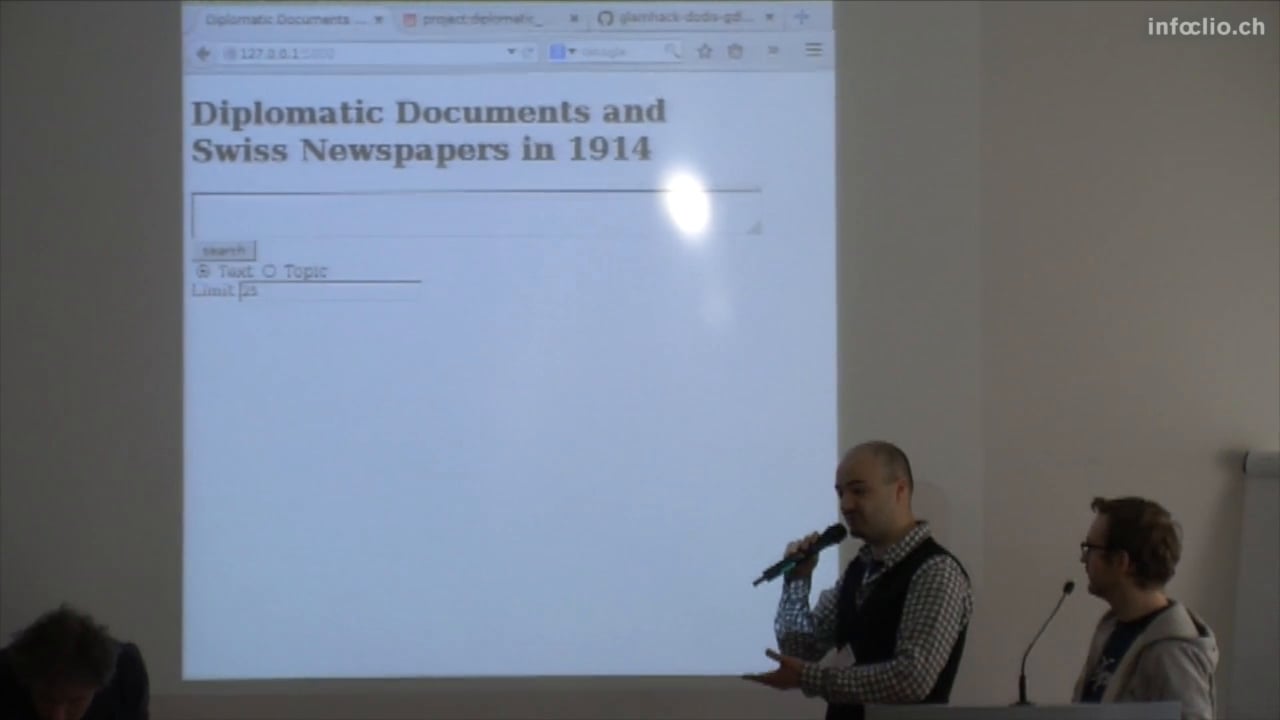
This project gathers two data sets: Diplomatic Documents of Switzerland and Le Temps Historical Archive for year 1914. Our aim is to find links between the two data sets to allow users to more easily search the corpora together. The project is composed by two parts:
- The Geographical Browser of the corpora. We extract all places from Dodis metadata and all places mentioned in each article of Le Temps, we then match documents and articles that refer to the same places and visualise them on a map for geographical browsing.
- The Text similarity search of the corpora. We train two models on the Le Temps corpus: Term Frequency Inverse Document Frequency and Latent Semantic Indexing with 25 topics. We then develop a web interface for text similarity search over the corpus and test it with Dodis summaries and full text documents.
Data and source code
-
Data.zip (CC BY 4.0) (DropBox)
Documentation
In this project, we want to connect newspaper articles from Journal de Genève (a Genevan daily newspaper) and the Gazette de Lausanne to a sample of the Diplomatic Documents in Switzerland database (Dodis). The goal is to conduct requests in the Dodis descriptive metadata to look for what appears in a given interval of time in the press by comparing occurrences from both data sets. Thus, we should be able to examine if and how the written press reflected what was happening at the diplomatic level. The time interval for this project is the summer of 1914.
In this context, at first we cleaned the data, for example by removing noise caused by short strings of characters and stopwords. The cleansing is a necessary step to reduce noise in the corpus. We then compared prepared tfidf vectors of words and LSI topics and represented each article in the corpus as such. Finally, we indexed the whole corpus of Le Temps to prepare it for similarity queries. THe last step was to build an interface to search the corpus by entering a text (e.g., a Dodis summary).
Difficulties were not only technical. For example, the data are massive: we started doing this work on fifteen days, then on three months. Moreover, some Dodis documents were classified (i.e. non public) at the time, therefore some of the decisions don't appear in the newspapers articles. We also used the TXM software, a platform for lexicometry and text statistical analysis, to explore both text corpora (the DODIS metadata and the newspapers) and to detect frequencies of significant words and their presence in both corpora.
Dodis Map
Team
Graphing the Stateless People in Carl Durheim's Photos
CH-BAR has contributed 222 photos by Carl Durheim, taken in 1852 and 1853, to Wikimedia Commons. These pictures show people who were in prison in Bern for being transients and vagabonds, what we would call travellers today. Many of them were Yenish. At the time the state was cracking down on people who led a non-settled lifestyle, and the pictures (together with the subjects' aliases, jobs and other information) were intended to help keep track of these “criminals”.
Since the photos' metadata includes details of the relationships between the travellers, I want to try graphing their family trees. I also wonder if we can find anything out by comparing the stated places of origin of different family members.
I plan to make a small interactive webapp where users can click through the social graph between the travellers, seeing their pictures and information as they go.
I would also like to find out more about these people from other sources … of course, since they were officially stateless, they are unlikely to have easily-discoverable certificates of birth, death and marriage.
-
Source code: downloads photographs from Wikimedia, parses metadata and creates a Neo4j graph database of people, relationships and places
Data
- Category:Durheim portraits contributed by CH-BAR on Wikimedia
Team
Links
Historical Tarot Freecell

Historical playing cards are witnesses of the past, icons of the social and economic reality of their time. On display in museums or stored in archives, ancient playing cards are no longer what they once were meant to be: a deck of cards made for playful entertainment. This project aims at making historical playing cards playable again by means of the well-known solitaire card game "Freecell".

 Tarot Freecell is a fully playable solitaire card game coded in HTML 5. It offers random setup, autoplay, reset and undo options. The game features a historical 78-card deck used for games and divination. The cards were printed in the 1880s by J. Müller & Cie., Schaffhausen, Switzerland.
The cards need to be held upright and use Roman numeral indexing. The lack of modern features like point symmetry and Arabic numerals made the deck increasingly unpopular.
Due to the lack of corner indices - a core feature of modern playing cards - the vertical card offset needs to be significantly higher than in other computer adaptations.
Instructions
Cards are dealt out with their faces up into 8 columns until all 52 cards are dealt. The cards overlap but you can see what cards are lying underneath. On the upper left side there is space for 4 cards as a temporary holding place during the game (i.e. the «free cells»). On the upper right there is space for 4 stacks of ascending cards to begin with the aces of each suit (i.e. the «foundation row»).
Look for the aces of the 4 suits – swords, sticks, cups and coins. As soon as the aces are free (which means that there are no more cards lying on top of them) they will flip to the foundation row. Play the cards between the columns by creating lines of cards in descending order, alternating between swords/sticks and cups/coins. For example, you can place a swords nine onto a coins ten, or a cups jack onto a sticks queen.
Placing cards onto free cells (1 card per cell only) will give you access to other cards in the columns. Look for the lower numbers of each suit and move cards to gain access to them. You can move entire stacks, the number of cards moveable at a time is limited to the number of free cells (and empty stacks) plus one.
The game strategy comes from moving cards to the foundations as soon as possible. Try to increase the foundations evenly, so you have cards to use in the columns. If «Auto» is switched on, cards no other card can be placed on will automatically flip to the foundations.
You win the game when all 8 columns are sorted in descending order. All remaining cards will then flip to the foundations, from ace to king in each suit.
Updates
2015/02/27 v1.0: Basic game engine
2015/02/28 v1.1: Help option offering modern suit and value indices in the upper left corner
2015/03/21 v1.1: Retina resolution and responsive design
Data
- Wikipedia: Tarot 1JJ
- Wikimedia Commons: Tarot 1JJ card set
Author
- Prof. Thomas Weibel, Thomas Weibel Multi & Media
Historical Views of Zurich Data Upload

Preparation of approx. 200 historical photographs and pictures of the Baugeschichtliches Archiv Zurich for upload unto Wikimedia Commons. Metadata enhancing, adding landmarks and photographers as additional category metadata
Team
- Micha Rieser
- Reto Wick
- wild
- Marco Sieber
- Martin E. Walder
- and other team members
Lausanne Historic GeoGuesser
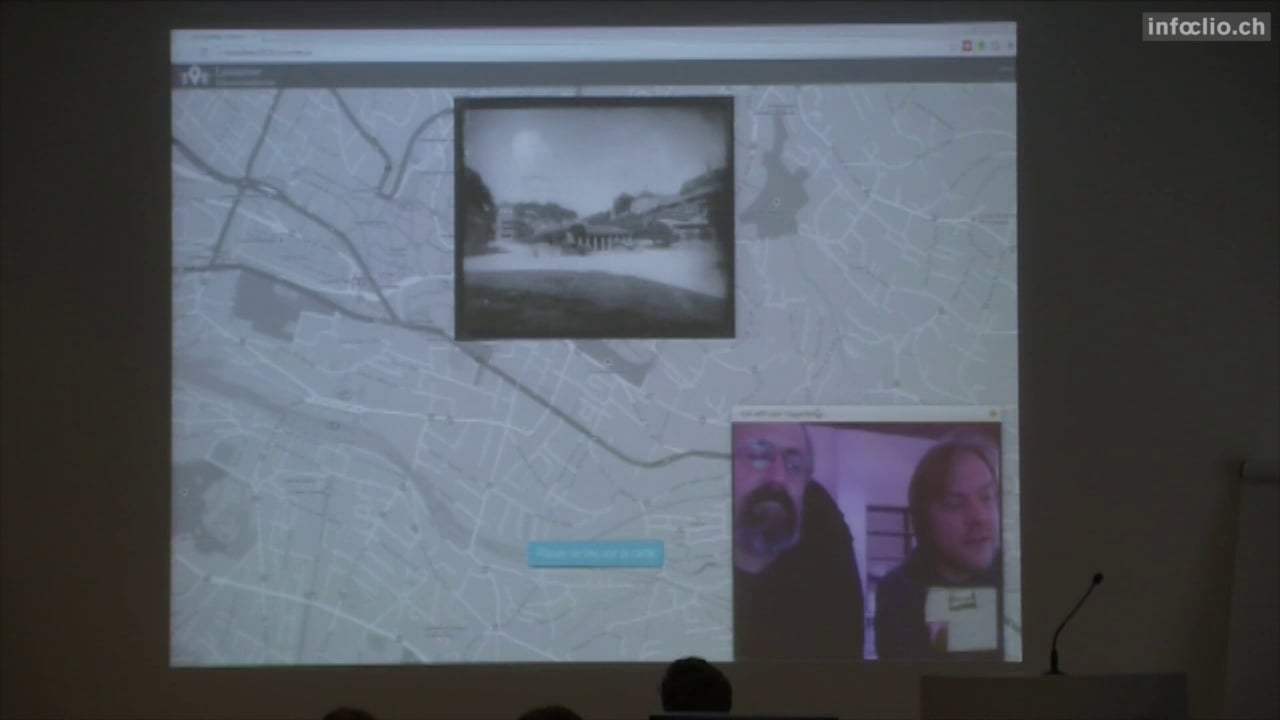
http://hackathon2015.cruncher.ch/
A basic GeoGuesser game using pictures of Lausanne from the 19th century. All images are available on http://musees.lausanne.ch/ and are are part of the Musée Historique de Lausanne Collection.
Data
Team
Oldmaps online


screenshot: map from Ryhiner collection in oldmapsonline
Integrate collections of historical Swiss maps into the open platform www.oldmapsonline.org. At least the two collections Rhyiner (UB Bern) and manuscript maps from Zentralbibliothek Zurich.
Pilot for georeferencing maps from a library (ZBZ).
Second goal: to load old maps into a georefencing system and create a competition for public.
For the hackathon maps and metadata will be integrated in the mentioned platform. At the moment the legal status of metadata from Swiss libraries is not yet clear and only a few maps are in public domain (collection Ryhiner at UB Bern).
Another goal is to create a register of historical maps from Swiss collections.
Data
-
www.zumbo.ch old maps from a private collection (Marcel Zumstein).
-
Sammlung Ryhiner (University Library Bern): published in public domain
-
Here is the webpage for the georeferencing competition: http://klokan.github.io/openglambern/
-
georeferencing tool (by klokan) with random map: http://zumbo.georeferencer.com/random
Team
-
Peter Pridal, Günter Hipler, Rudolf Mumenthaler
Links
-
Documentation: Google Doc of #glamhack
-
Blog or forum posts will follow…
-
Tools we used: http://project.oldmapsonline.org/contribute for the metadata scheme (spreadsheet);
OpenGLAM Inventory
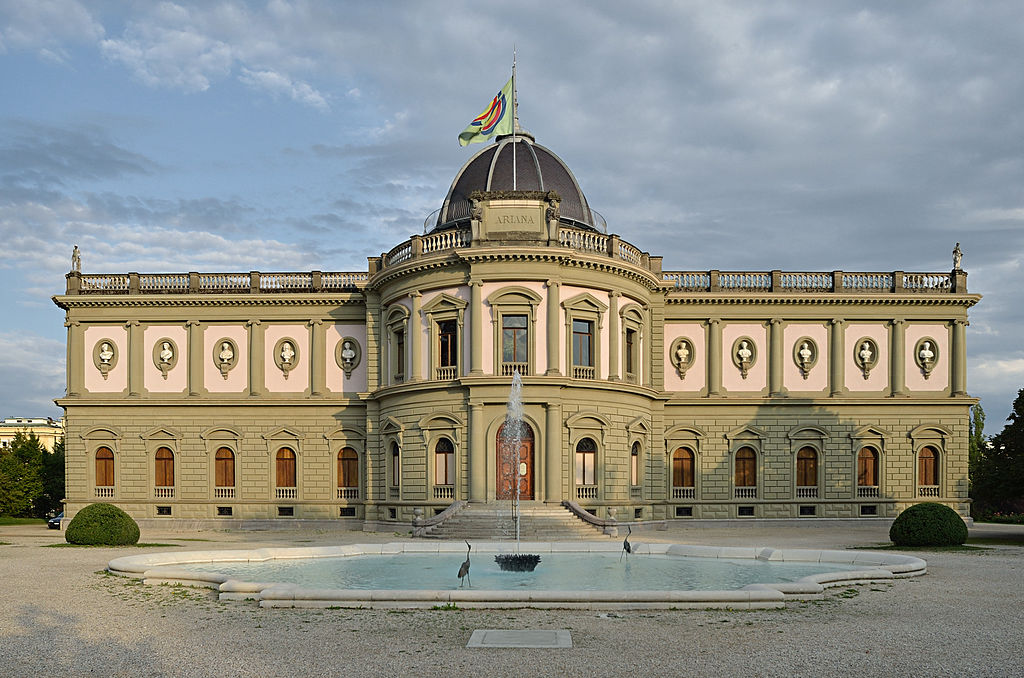
Gfuerst, CC by-sa 3.0, via Wikimedia Commons
Idea: Create a database containing all the heritage institutions in Switzerland. For each heritage institution, all collections are listed. For each collection the degree of digitization and the level of openness are indicated: metadata / content available in digital format? available online? available under an open license? etc. - The challenge is twofold: First, we need to find a technical solution that scales well over time and across national borders. Second, the processes to regularly collect data about the collections and their status need to be set up.
Step 1: Compilation of various existing GLAM databases (done)
National inventories of heritage institutions are created as part of the OpenGLAM Benchmark Survey; there is also a network of national contacts in a series of countries which have been involved in a common data collection exercise.
Step 2: GLAM inventory on Wikipedia (ongoing)
Port the GLAM inventory to Wikipedia, enrich it with links to existing Wikipedia articles: See
German Wikipedia|Project "Schweizer Gedächtnisinstitutionen in der Wikipedia".
Track the heritage institutions' presence in Wikipedia.
Encourage the Wikipedia community to write articles about institutions that haven't been covered it in Wikipedia.
Once all existing articles have been repertoried, the inventory can be transposed to Wikidata.
Further steps
-
Provide a basic inventory as a Linked Open Data Service
-
Create an inventory of collections and their accessibility status
Data
-
Swiss GLAM Inventory (Datahub)
Team
-
various people from the Wikipedia communtiy
-
and maybe you?
Picture This

Story
-
The Picture This “smart” frame shows police photographs of homeless people by Carl Durheim (1810-1890)
-
By looking at a picture, you trigger a face detection algorithm to analyse both, you and the homeless person
-
The algorithm detects gender, age and mood of the person on the portrait (not always right)
-
You, as a spectator, become part of the system / algorithm judging the homeless person
-
The person on the picture is at the mercy of the spectator, once again
How it works
-
Picture frame has a camera doing face detection for presence detection
-
Pictures have been pre-processed using a cloud service
-
Detection is still rather slow (should run faster on the Raspi 2)
-
Here's a little video https://www.flickr.com/photos/tamberg/16053255113/
Questions (not) answered
-
Who were those people? Why were they homeless? What was their crime?
-
How would we treat them? How will they / we be treated tomorrow? (by algorithms)
Data
Team
-
@ram00n
-
@tamberg
-
and you
Ideas/Iterations
-
Download the pictures to the Raspi and display one of them (warmup)
-
Slideshow and turning the images 90° to adapt to the screensize
-
Play around with potentiometer and Arduino to bring an analog input onto the Raspi (which only has digital I/O)
-
Connect everything and adapt the slideshow speed with the potentiometer
-
Display the name (extracted from the filename) below the picture
next steps, more ideas:
-
Use the Raspi Cam to detect a visitor in front of the frame and stop the slideshow
-
Use the Raspi Cam to take a picture of the face of the visitor
-
Detect faces in the camera picture
-
Detect faces in the images [DONE, manually, using online service]
-
…merge visitor and picture faces

Material
-
7inch TFT https://www.adafruit.com/products/947
-
Picture frame http://www.thingiverse.com/thing:702589
Software
-
http://www.raspberrypi.org/downloads/ - Raspbian
-
http://www.pygame.org - A game framework, allows easy display of images
-
https://bitbucket.org/tamberg/makeopendata/src/tip/2015/PictureThis - Scraper and Display
Links
-
http://www.raspberrypi.org/facial-recognition-opencv-on-the-camera-board/ - OpenCV on Raspi-Cam
-
https://speakerdeck.com/player/083e55006e4a013063711231381528f7 - Slide 106 for face replacement
Not used this time, but might be useful
-
https://thinkrpi.wordpress.com/2013/05/22/opencv-and-camera-board-csi/ - old Raspian versions did not have the latest OpenCV installed. Nice howto for that
-
https://realpython.com/blog/python/face-recognition-with-python/ - OpenCV, nice but not used
-
http://docs.opencv.org - not used directly, only via SimpleCV
-
http://makezine.com/projects/pi-face-treasure-box/ - maybe a nice weekend project
-
http://www.aliexpress.com/item/FreeShipping-Banana-Pro-Pi-7-inch-LVDS-LCD-Module-7-Touch-Screen-F-Raspberry-Pi-Car/32246029570.html - 7inch TFT mit LVDS Flex Connector
Portrait Id

(Original working title: Portrait Domain)
This is a concept for an gamified social media platform / art installation aiming to explore alternate identity, reflect on the usurping of privacy through facial recognition technology, and make use of historic digitized photographs in the Public Domain to recreate personas from the past. Since the #glamhack event where this project started, we have developed an offline installation which uses Augmented Reality to explore the portraits. See videos on Twitter or Instagram.
View the concept document for a full description.
Data
The exhibit gathers data on user interactions with historical portraits, which is combined with analytics from the web application on the Logentries platform:
Team
Launched by loleg at the hackdays, this project has already had over a dozen collaborators and advisors who have kindly shared time and expertise in support. Thank you all!
Please also see the closely related projects picturethis and graphing_the_stateless.
Links
Public Domain Game


A card game to discover the public domain. QR codes link physical cards with data and digitized works published online. This project was started at the 2015 Open Cultural Data Hackathon.
Sources
Team
-
Mario Purkathofer
-
Joël Vogt
-
Bruno Schlatter
Schweizer Kleinmeister: An Unexpected Journey

This project shows a large image collection in an interactive 3D-visualisation. About 2300 prints and drawings from “Schweizer Kleinmeister” from the Gugelmann Collection of the Swiss National Library form a cloud in the virtual space.
The images are grouped according to specific parameters that are automatically calculated by image analysis and based on metadata. The goal is to provide a fast and intuitive access to the entire collection, all at once. And this not accomplished by means of a simple list or slideshow, where items can only linearly be sorted along one axis like time or alphabet. Instead, many more dimensions are taken into account. These dimensions (22 for techniques, 300 for image features or even 2300 for descriptive text analysis) are then projected onto 3D space, while preserving topological neighborhoods in the original space.
The project renounces to come up with a rigid ontology and forcing the items to fit in premade categories. It rather sees clusters emerge from attributes contained in the images and texts themselves. Groupings can be derived but are not dictated.
The user can navigate through the cloud of images. Clicking on one of the images brings up more information about the selected artwork. For the mockup, three different non-linear groupings were prepared. The goal however is to make the clustering and selection dependent on questions posed by any individual user. A kind of personal exhibition is then curated, different for every spectator.
Open Data used
Gugelmann Collection, Swiss National Library
http://opendata.admin.ch/en/dataset/sammlung-gugelmann-schweizer-kleinmeister
http://commons.wikimedia.org/wiki/Category:CH-NB-Collection_Gugelmann
Team
-
Sonja Gasser ( @sonja_gasser)
Links
Spock Monroe Art Brut
(Click image for full-size download on DeviantArt)
This is a photo mosaic based on street art in SoHo, New York City - Spock\Monroe (CC BY 2.0) as photographed by Ludovic Bertron . The mosaic is created out of miniscule thumbnails (32 pixels wide/tall) of 9486 images from the Collection de l'Art Brut in Lausanne provided on http://musees.lausanne.ch/ using the Metapixel software running on Linux at the 1st Swiss Open Cultural Data Hackathon.
This is a humble tribute to Leonard Nimoy, who died at the time of our hackathon.
Data
Team
Swiss Games Showcase

A website made to show off the work of the growing Swiss computer game scene. The basis of the site is a crowdsourced list of Swiss games. This list is parsed, and additional information on each game is automatically gathered. Finally, a static showcase page is generated.
Data
-
Source List on Google Docs of Released and Playable Swiss Video Games
Team
The Endless Story

Data
Team
Links
Thematizer

Problem:
There are a lot of cultural data (meta-data, texts, videos, photos) available to the community, in Open Data format or not, that are not valued and sleep in data silos.
These data could be used, non-exhaustively, in the areas of tourism (services or products creations highlighting the authenticity of the visited area) or in museums (creation of thematic visits based on visitors profiles)
Proposition:
We propose to work on an application able to request different local specialized cultural datasets and make links, through the result, with the huge, global, universal, Wikipedia and Google Map to enrich the cultural information returned to the visitor.
Prototype 1 (Friday):
One HTML page with a search text box and a button. It requests Wikipedia with the value, collect the JSON page’s content, parse the Table of Content in order to keep only level 1 headers, display the result in both vertical list and word cloud.
Prototype 2 (Saturday):
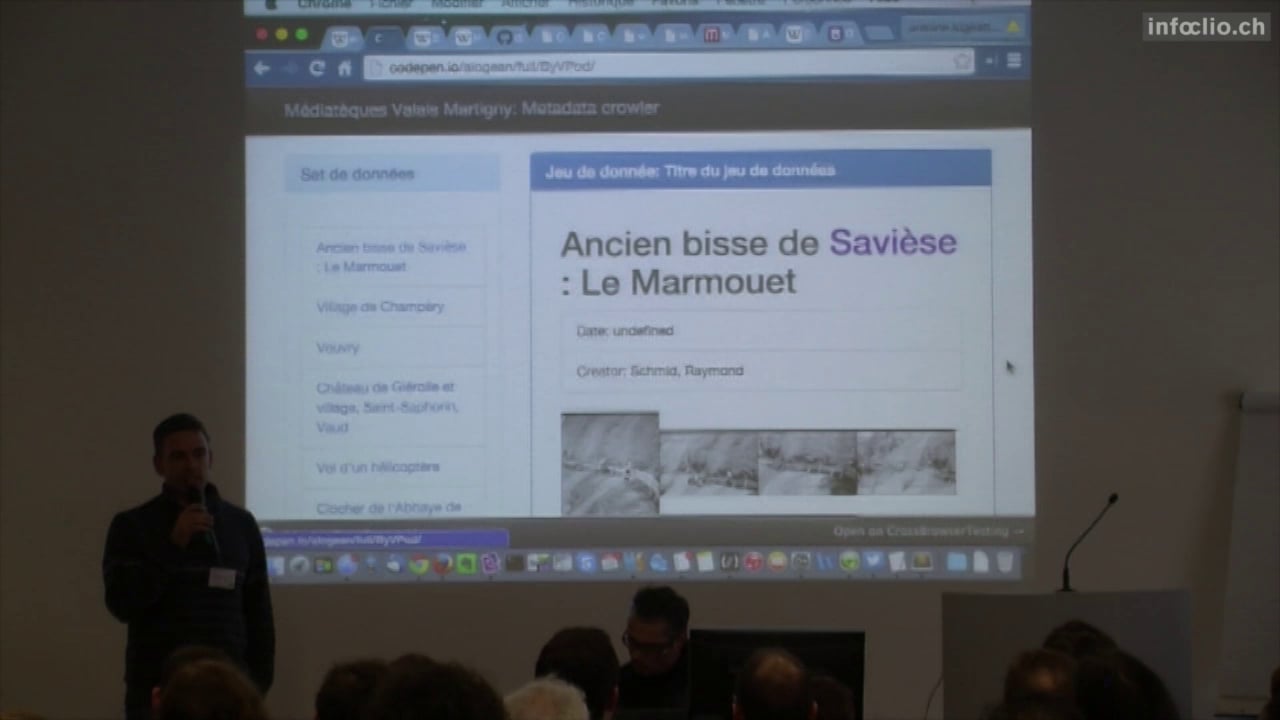
One HTML page accessing the dataset from the Mediathèque of Valais (http://xml.memovs.ch/oai/oai2.php?verb=ListIdentifiers&metadataPrefix=oai_dc&set=k), getting all the “qdc” XML pages and displaying them in a vertical list. When you click on one of those topics, on the right of the page you will get some information about the topic, one image (if existing) and a cloud of descriptions. Clicking on one of the descriptions will then request Wikipedia with that value and display the content.
If we have enough time we will also get a location tag from the Mediathèque XML file and then display a location on Google Map.
Demo
-
http://codepen.io/alogean/full/ByVPod/ (last version)
Resources (examples, similar applications, etc.):
This idea is based on a similar approach that has been developed during Museomix 2014 : http://www.museomix.org/prototypes/museochoix/ . We are trying to figure out how to extend this idea to other contexts than the museums and to other datasets than those proposed by that particular museum.
Data
Example of made requests:
Other potentially interesting datasets for future work:
Team
Links
-
https://twitter.com/mdammers?lang=fr . Link to the Wikidata expert who gave us some useful links to the Wikipedia API.
-
https://pad.okfn.org/p/Lausanne_Museums_GLAMhack . Pad with information about the Museris 3.0 initiative in Lausanne and access to their manual database of meta-data. (Not sure the links will work very long after the hackday…)
ViiSoo
Exploring a water visualisation and sonification remix with Open Data,
to make it accessible for people who don't care about data.
Why water? Water is a open accessible element for life. It
flows like data and everyone should have access to it.
We demand Open Access to data and water.
Join us, we have stickers.
Open Data Used
Tec / Libraries
-
HTML5, Client Side Javascript, CSS and Cowbells
Team
Created by the members of Kollektiv Zoll
ToDoes
-
Flavours (snow, lake, river)
-
Image presentation
-
Realtime Input and Processing of Data from an URL
See it live
Solothurner Kościuszko-Inventar
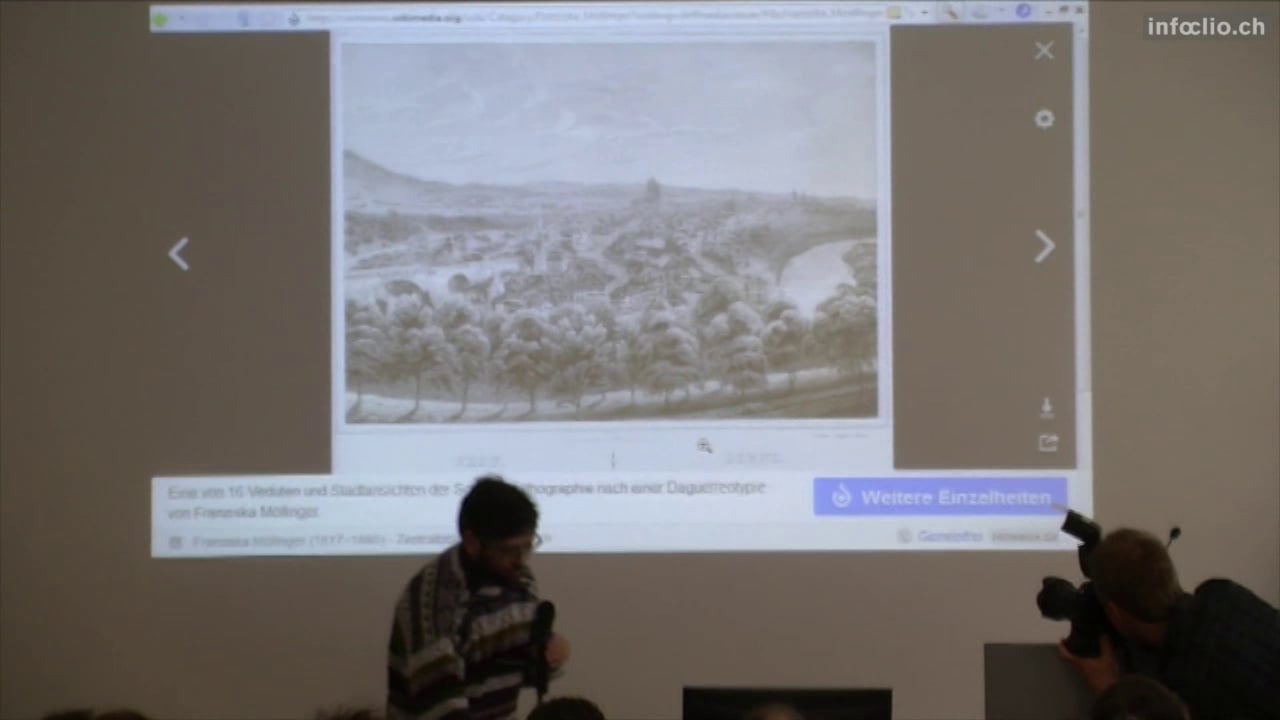
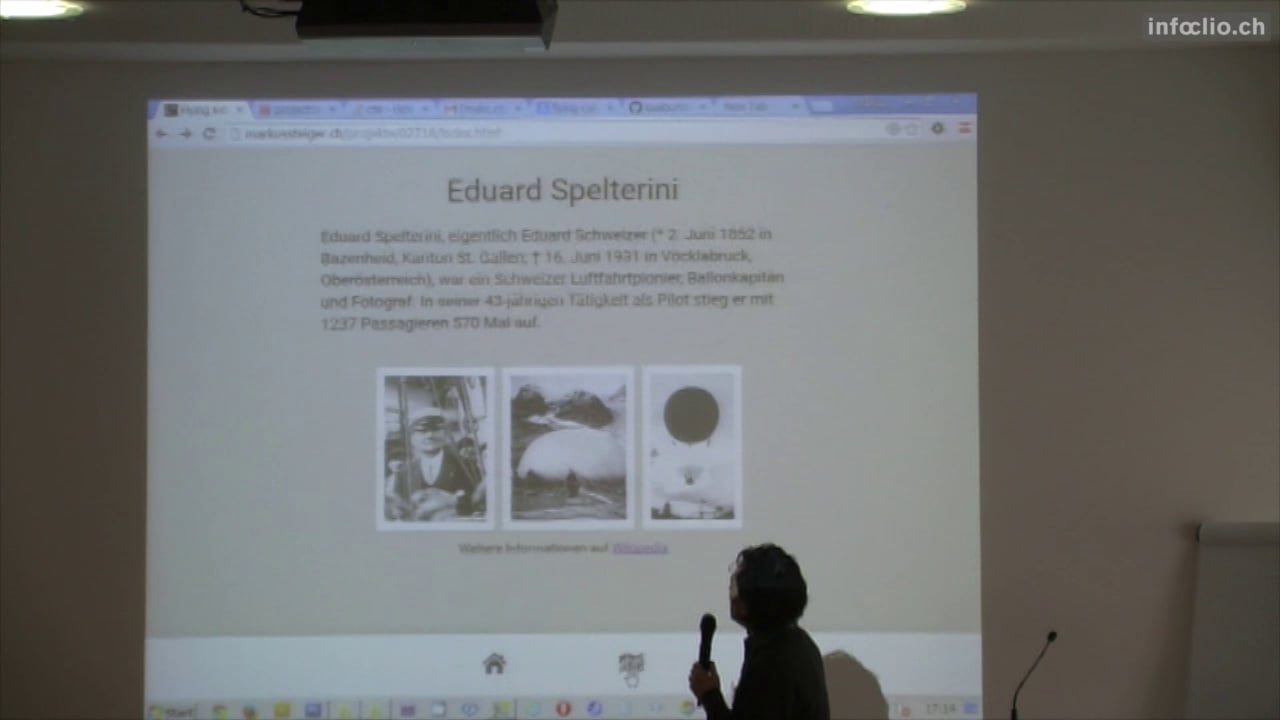
Webapp Eduard Spelterini
PreOCR
Animation in the spirit of dada poetry

The computer produces animations. Dada! All your artworks are belong to us. We build the parameters, you watch the animations. Words, images, collide together into ever changing, non-random, pseudo-random, deliberately unpredictable tensile moments of social media amusement. Yay!
For this first prototype we used Walter Serner’s Text “Letzte Lockerung – Manifest Dada” as a source. This text is consequently reconfigured, rewritten and thereby reinterpreted by the means of machine learning using “char-rnm”.
Images in the public domain snatched out of the collection “Wandervögel” from the Schweizerische Sozialarchiv.
Data
-
Images are taken from the collection Wandervögel from the Schweizerische Sozialarchiv
-
Text Walter Serner Letzte Lockerung - Manifest Dada
-
Tool char-rnn
Team
Performing Arts Ontology
The goal of the project is to develop an ontology for the performing arts domain that allows to describe the holdings of the Swiss Archives for the Performing Arts (formerly Swiss Theatre Collection and Swiss Dance Collection) and other performing arts related holdings, such as the holdings represented on the Performing Arts Portal of the Specialized Information Services for the Performing Arts (Goethe University Frankfurt).
See also: Project "Linked Open Theatre Data"
Data
-
Data from the www.performing-arts.eu Portal
Project Outputs
2017:
-
Draft Version of the Swiss Performing Arts Ontology (Pre-Release, 24 May 2017)
2016:
-
Initial Data Modelling Experiments: Swiss Performing Arts Vocabulary (deprecated)
Resources
Team
-
Christian Schneeberger
-
Birk Weiberg
-
René Vielgut (2016)
-
Julia Beck
-
Adrian Gschwend
Kamusi Project: Every Word in Every Language
We are developing many resources built around linguistic data, for languages around the world. At the Cultural Data hackathon, we are hoping for help with:
-
An application for translating museum exhibit information and signs in other public spaces (zoos, parks, etc) to multiple languages, so visitors can understand the exhibit no matter where they come from. We currently have a prototype for a similar application for restaurants.
-
Cultural datasets: we are looking for multilingual lexicons that we can incorporate into our db, to enhance the general vocabulary that we have for many languages.
-
UI design improvements. We have software, but it's not necessarily pretty. We need the eyes of designers to improve the user experience.
Data
-
List and link your actual and ideal data sources.
Team
Historical Dictionary of Switzerland Out of the Box
The Historical Dictionary of Switzerland (HDS) is an academic reference work which documents the most important topics and objects of Swiss history from prehistory up to the present.
The HDS digital edition comprises about 36.000 articles organized in 4 main headword groups:
- Biographies,
- Families,
- Geographical entities and
- Thematical contributions.
Beyond the encyclopaedic description of entities/concepts, each article contains references to primary and secondary sources which supported authors when writing articles.
Data
We have the following data:
* metadata information about HDS articles Historical Dictionary of Switzerland comprising:
-
bibliographic references of HDS articles
-
article titles
* Le Temps digital archive for the year 1914
Goals
Our projects revolve around linking the HDS to external data and aim at:
-
Entity linking towards HDS
The objective is to link named entity mentions discovered in historical Swiss newspapers to their correspondant HDS articles.
-
Exploring reference citation of HDS articles
The objective is to reconcile HDS bibliographic data contained in articles with SwissBib.
Named Entity Recognition
We used web-services to annotate text with named entities:
- Dandelion
- Alchemy
- OpenCalais
Named entity mentions (persons and places) are matched against entity labels of HDS entries and directly linked when only one HDS entry exists.
Further developments would includes:
- handling name variants, e.g. 'W.A. Mozart' or 'Mozart' should match 'Wolfgang Amadeus Mozart' .
- real disambiguation by comparing the newspaper article context with the HDS article context (a first simple similarity could be tf-idf based)
- working with a more refined NER output which comprises information about name components (first, middle,last names)
Bibliographic enrichment
We work on the list of references in all articles of the HDS, with three goals:
-
Finding all the sources which are cited in the HDS (several sources are cited multiple times) ;
-
Link all the sources with the SwissBib catalog, if possible ;
-
Interactively explore the citation network of the HDS.
The dataset comes from the HDS metadata. It contains lists of references in every HDS article:
Result of source disambiguation and look-up into SwissBib:
Bibliographic coupling network of the HDS articles (giant component). In Bibliographic coupling two articles are connected if they cite the same source at least once.
Biographies (white), Places (green), Families (blue) and Topics (red):
Ci-citation network of the HDS sources (giant component of degree > 15). In co-citation networks, two sources are connected if they are cited by one or more articles together.
Publications (white), Works of the subject of an article (green), Archival sources (cyan) and Critical editions (grey):
Team
- odi
- julochrobak
- and other team members
Visualize Relationships in Authority Datasets

Raw MACS data:
Transforming data.
Visualizing MACS data with Neo4j:
Visualization showing 300 respectively 1500 relationships:

Visualization showing 3000 relationships. For an exploration of the relations you find a high-res picture here graph_3000_relations.png (10.3MB)

Please show me the shortest path between “Rechtslehre” und “Ernährung”:
Some figures
-
original MACS dataset: 36.3MB
-
'wrangled' MACS dataset: 171MB
-
344134 nodes in the dataset
-
some of our laptops have difficulties to handle visualization of more than 4000 nodes :(
Datasets
-
MACS - Multilingual Access to Subjects http://www.dnb.de/DE/Wir/Kooperation/MACS/macs_node.html
-
GND - Gemeinsame Normdatei http://www.dnb.de/DE/Standardisierung/GND/gnd_node.html
Process
-
get data
-
transform data (e.g. with “Metafactor”)
-
load data in graph database (e.g. “Neo4j”)
*its not as easy as it sounds
Team
-
Günter Hipler
-
Silvia Witzig
-
Sebastian Schüpbach
-
Sonja Gasser
-
Jacqueline Martinelli
Dodis Goes Hackathon
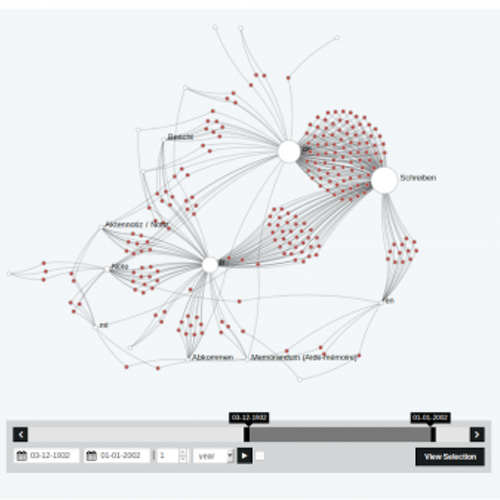
Wir arbeiten mit den Daten zu den Dokumenten von 1848-1975 aus der Datenbank Dodis und nutzen hierfür Nodegoat.
Animation (mit click öffnen):
Data
Team
-
Christof Arnosti
-
Amandine Cabrio
-
Lena Heizmann
-
Christiane Sibille
VSJF-Refugees Migration 1898-1975 in Switzerland
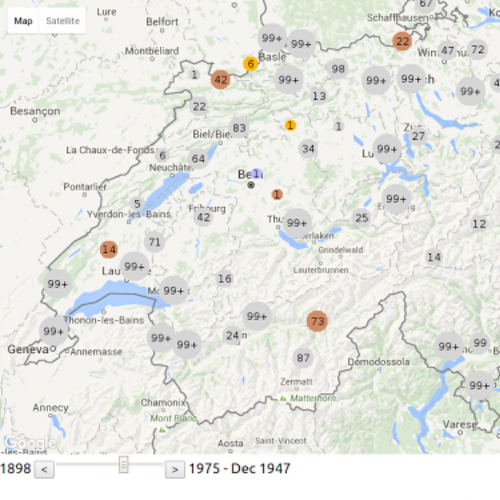

We developed an interactive visualization of the migration flow of (mostly jewish) refugees migrating to or through Switzerland between 1898-1975. We used the API of google maps to show the movement of about 20'000 refugees situated in 535 locations in Switzerland.
One of the major steps in the development of the visualization was to clean the data, as the migration route is given in an unstructured way. Further, we had to overcame technical challenges such as moving thousands of marks on a map all at once.
The journey of a refugee starts with the place of birth and continues with the place from where Switzerland was entered (if known). Then a series of stays within Switzerland is given. On average a refugee visited 1 to 2 camps or homes. Finally, the refugee leaves Switzerland from a designated place to a destination abroad. Due to missing information some of the dates had to be estimated, especially for the date of leave where only 60% have a date entry.
The movements of all refugees can be traced over time in the period of 1898-1975 (based on the entry date). The residences in Switzerland are of different types and range from poor conditions as in prison camps to good conditions as in recovery camps. We introduced a color code to display different groups of camps and homes: imprisoned (red), interned (orange), labour (brown), medical (green), minors (blue), general (grey), unknown (white).
As additional information, to give the dots on the map a face, we researched famous people who stayed in Switzerland in the same time period. Further, historical information were included to connect the movements of refugees to historical events.
Data
Code
Team
-
Bourdic Maïwenn
-
Noyer Frédéric
-
Tutav Yasemin
-
Züger Marlies
Manesse Gammon
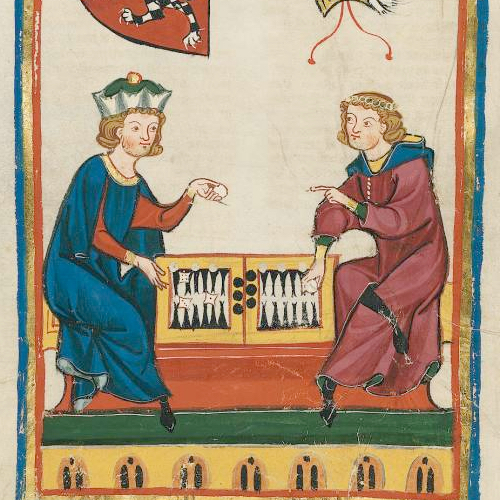
The Codex Manesse, or «Große Heidelberger Liederhandschrift», is an outstanding source of Middle High German Minnesang, a book of songs and poetry the main body of which was written and illustrated between 1250 and 1300 in Zürich, Switzerland. The Codex, produced for the Manesse family, is one of the most beautifully illustrated German manuscripts in history.
The Codex Manesse is an anthology of the works of about 135 Minnesingers of the mid 12th to early 14th century. For each poet, a portrait is shown, followed by the text of their works. The entries are ordered by the social status of the poets, starting with the Holy Roman Emperor Heinrich VI, the kings Konrad IV and Wenzeslaus II, down through dukes, counts and knights, to the commoners.
Page 262v, entitled «Herr Gœli», is named after a member of the Golin family originating from Badenweiler, Germany. «Herr Gœli» may have been identified either as Konrad Golin (or his nephew Diethelm) who were high ranked clergymen in 13th century Basel. The illustration, which is followed by four songs, shows «Herrn Gœli» and a friend playing a game of Backgammon (at that time referred to as «Pasch», «Puff», «Tricktrack», or «Wurfzabel»). The game is in full swing, and the players argue about a specific move.
Join in and start playing a game of backgammon against «Herrn Gœli». But watch out: «Herr Gœli» speaks Middle High German, and despite his respectable age he is quite lucky with the dice!
Instructions
You control the white stones. The object of the game is to move all your pieces from the top-left corner of the board clockwise to the bottom-left corner and then off the board, while your opponent does the same in the opposite direction. Click on the dice to roll, click on a stone to select it, and again on a game space to move it. Each die result tells you how far you can move one piece, so if you roll a five and a three, you can move one piece five spaces, and another three spaces. Or, you can move the same piece three, then five spaces (or vice versa). Rolling doubles allows you to make four moves instead of two.
Note that you can't move to spaces occupied by two or more of your opponent's pieces, and a single piece without at least another ally is vulnerable to being captured. Therefore it's important to try to keep two or more of your pieces on a space at any time. The strategy comes from attempting to block or capture your opponent's pieces while advancing your own quickly enough to clear the board first.
And don't worry if you don't understand what «Herr Gœli» ist telling you in Middle High German: Point your mouse to his message to get a translation into modern English.
Updates
2016/07/01 v1.0: Index page, basic game engine
2016/07/02 v1.1: Translation into Middle High German, responsive design
2016/07/04 v1.11: Minor bug fixes
Data
-
Universitätsbibliothek Heidelberg: Der Codex Manesse und die Entdeckung der Liebe
-
Universitätsbibliothek Heidelberg: Große Heidelberger Liederhandschrift – Cod. Pal. germ. 848 (Codex Manesse)
-
Wikimedia Commons: Codex Manesse
-
Historisches Lexikon der Schweiz: Manessische Handschrift
-
Historisches Lexikon der Schweiz: Baden, von
-
Wörterbuchnetz: Mittelhochdeutsches Handwörterbuch von Matthias Lexer
Author
-
Prof. Thomas Weibel, Thomas Weibel Multi & Media
Historical maps

The group discussed the usage of historical maps and geodata using the Wikimedia environment. Out of the discussion we decided to work on 4 learning items and one small hack.
The learning items are:
-
The workflow for historical maps - the Wikimaps workflow
-
Wikidata 101
-
Public artworks database in Sweden - using Wikidata for storing the data
-
Mapping maps metadata to Wikidata: Transitioning from the map template to storing map metadata in Wikidata. Sum of all maps?
The small hack is:
-
Creating a 3D gaming environment in Cities Skylines based on data from a historical map.
Data
This hack is based on an experimentation to map a demolished and rebuilt part of Helsinki. In DHH16, a Digital Humanities hackathon in Helsinki this May, the goal was to create a historical street view. The source aerial image was georeferenced with Wikimaps Warper, traced with OpenHistoricalMap, historical maps from the Finna aggregator were georeferenced with the help of the Geosetter program and finally uploaded to Mapillary for the final street view experiment.
The Small Hack - Results
Our goal has been to recreate the historical area of Helsinki in a modern game engine provided by Cities: Skylines (Developer: Colossal Order). This game provides a built-in map editor which is able to read heightmaps (DEM) to rearrange the terrain according to it. Though there are some limits to it: The heightmap has to have an exact size of 1081x1081px in order to be able to be translated to the game's terrain.
To integrate streets and railways into the landscape, we tried to use an already existing modification for Cities: Skylines which can be found in the Steam Workshop: Cimtographer by emf. Given the coordinates of the bounding box for the terrain, it is supposed to read out the geometrical information of OpenStreetMap. A working solution would be amazing, as one would not only be able to read out information of OSM, but also from OpenHistoricalMap, thus being able to recreate historical places. Unfortunately, the algorithm is not working that properly - though we were able to create and document some amazing “street art”.
Another potential way of how to recreate the structure of the cities might be to create an aerial image overlay and redraw the streets and houses manually. Of course, this would mean an enormous manual work.
Further work can be done regarding the actual buildings. Cities: Skylines provides the opportunity to mod the original meshes and textures to bring in your very own structures. It might be possible to create historical buildings as well. However, one has to think about the proper resolution of this work. It might also be an interesting task to figure out how to create low resolution meshes out of historical images.
Team
-
Susanna Ånäs
Visual Exploration of Vesalius' Fabrica

Screenshots of the prototype
Description
We are using cultural data of a rare copy of DE HUMANI CORPORIS FABRICA combined with a quantitive and qualitative analysis of visual content. This all is done without reading a single text page. That means that we are trying to create a content independent visual analysis method, which would enable a public to have an overview and quick insight.
Process
Clickable Prototype
Some Gifs
Data
Team
-
Radu Suciu
-
Nicole Lachenmeier, www.yaay.ch
-
Indre Grumbinaite, www.yaay.ch
-
Danilo Wanner, www.yaay.ch
-
Darjan Hil, www.yaay.ch
-
Vlad Atanasiu
Sprichort
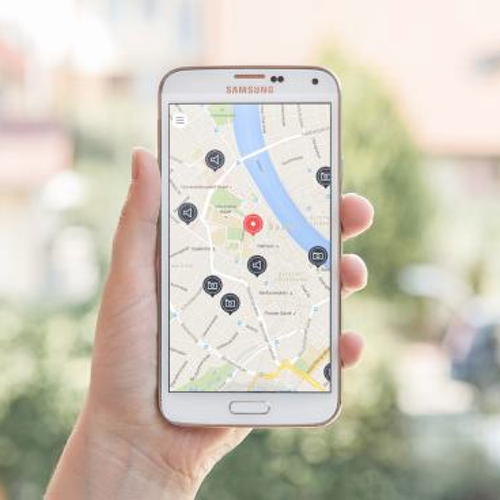
sprichort is an application which lets users travel in time. The basis are a map and historical photographs like Spelterini's photographs from his voyages to Egypt, across the Alps or to Russia. To each historical photograph comes an image of what it looks like now. So people can see change. The photographs are complemented with stories from people about this places and literary descriptions of this places.
An important aspect is participation. Users should be able to upload their own hostorical photographs and they should be able to provide actual photos to historical photographs.
The User Interface of the application:
Web
Data
Team
-
Ricardo Joss
-
Daisy Larios
-
Jia Chyi, Wang
-
Sabrina Montimurro
SFA-Metadata (swiss federal state archives) at EEXCESS
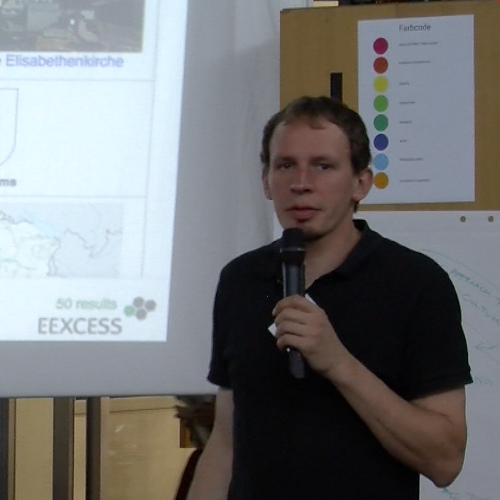
The goal of our „hack“ is to reuse existing search and visualization tools for dedicated datasets provided by the swiss federal state archives.
The project EEXCESS (EU funded research project, www.eexcess.eu) has the vision to unfold the treasure of cultural, educational and scientific long-tail content for the benefit of all users. In this context the project realized different software components to connect databases, providing means for both automated (recommender engine) and active search queries and a bunch of visualization tools to access the results.
The federal swiss state archives hosts a huge variety of digitized objects. We aim at realizing a dedicated connection of that data with the EEXCESS infrastructure (using a google chrome extension) and thus find out, whether different ways of visualizations can support intuitive access to the data (e.g. Creation of virtual landscapes from socia-economic data, browse through historical photographs by using timelines or maps etc.).
Let's keep fingers crossed …![]()
Data
Team
-
Louis Gantner
-
Daniel Hess
-
Marco Majoleth
-
André Ourednik
-
Jörg Schlötterer
#GlamHackClip2016
Short clip edited to document the GLAMHack 2016, featuring short interviews with hackathon participants that we recorded on site and additional material from the Open Cultural Data Sets made available for the hackathon.
Data
Music - Public Domain Music Recordings and Metadata / Swiss Foundation Public Domain
- Amilcare Ponchielli (1834-1886), La Gioconda, Dance of the hours (part 2), recorded in Manchester, 29. Juli 1941
- Joseph Haydn, Trumpet Concerto in E Flat, recorded on the 19. Juni 1946
Aerial Photographs by Eduard Spelterini / Swiss National Library
- Eduard Spelterini, Basel between 1893 and 1923. See picture.
- Eduard Spelterini, Basel between 1893 and 1902. See picture.
Bilder 1945-1973 / Dodis
- 1945: Ankunft jüdischer Flüchtlinge
- 1945: Flüchtlinge an der Grenze
Team
-
Jan Baumann (infoclio.ch)
-
Enrico Natale (infoclio.ch)
Wireless telegraphy and synchronisation of time. A transnational perspective

This paper, based on unpublished documents of the International Telecommunication Union’s archive and radio amateurs' magazines, discusses the multiform relationships between wireless telegraphy and time at the beginning of the 20th century. Specifically, it aims to analyze how time synchronization and wireless telegraphy depend on and refer to each other, explicitly and implicitly.
First, wireless became an essential infrastructure for time synchronization, when in 1912 the International Time Conference inaugurated the network of signaling stations with the Eiffel tower. Second, radio time signals brought forward the development of wireless and became one of the first widely accepted forms of radio broadcasting. Finally, this relation between time and wireless later evolved in new unforeseen applications that led to the development of other technologies, such as aviation and seismology. In conclusion, wireless generated new ideas, affected different technological fields, and changed the perception of distance and time.
Aufstieg und Niedergang des modernen Zeitregimes
Der Beitrag fragt nach dem Umgang mit Zeit, nach der Diskursivität von Zeit in der Geschichtsschreibung des 19. und der ersten Hälfte des 20. Jahrhunderts. Zeit als Wahrnehmungsmuster beeinflusst Modi und Ausformungen der Konstruktion von Erinnerung – von Geschichtsschreibung wie von anderen Erinnerungsmodi –, während letztere ihrerseits Zeitkonzeptionen und Deutungen von Zeit strukturieren und festschreiben. Es sollen Wege der Tiefenanalyse des Funktionierens von Erinnerungsdiskursen mit speziellem Blick auf die Geschichtsschreibung aufgezeigt werden, wobei ein dreifacher Fokus verfolgt wird: auf diskursive Dimensionen, welche Zeitwahrnehmung und Zeitdeutung zum Ausdruck bringen, auf deren Konstruktionslogiken sowie auf die Narrativität von Zeit, Geschichte und Gedächtnis.
Collaborative Face Recognition and Picture Annotation for Archives
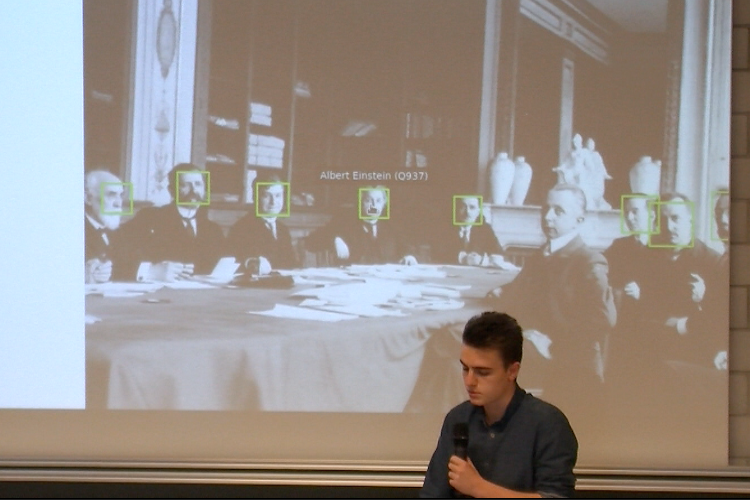
Le projet
 Les Archives photographiques de la Société des Nations (SDN) — ancêtre de l'actuelle Organisation des Nations Unies (ONU) — consistent en une collection de plusieurs milliers de photographies des assemblées, délégations, commissions, secrétariats ainsi qu'une série de portraits de diplomates. Si ces photographies, numérisées en 2001, ont été rendues accessible sur le web par l'Université de l'Indiana, celles-ci sont dépourvues de métadonnées et sont difficilement exploitables pour la recherche.
Notre projet est de valoriser cette collection en créant une infrastructure qui soit capable de détecter les visages des individus présents sur les photographies, de les classer par similarité et d'offrir une interface qui permette aux historiens de valider leur identification et de leur ajouter des métadonnées.
Le projet s'est déroulé sur deux sessions de travail, en mai (Geneva Open Libraries) et en septembre 2017 (3rd Swiss Open Cultural Data Hackathon), séparées ci-dessous.
Session 2 (sept. 2017)
L'équipe
| Université de Lausanne | United Nations Archives | EPITECH Lyon | Université de Genève |
|---|---|---|---|
| Martin Grandjean | Blandine Blukacz-Louisfert | Gregoire Lodi | Samuel Freitas |
| Colin Wells | Louis Schneider | ||
| Adrien Bayles | |||
| Sifdine Haddou |
Compte-Rendu
Dans le cadre de la troisième édition du Swiss Open Cultural Data Hackathon, l’équipe qui s’était constituée lors du pre-event de Genève s’est retrouvée à l’Université de Lausanne les 15 et 16 septembre 2017 dans le but de réactualiser le projet et poursuivre son développement.
Vendredi 15 septembre 2017
Les discussions de la matinée se sont concentrées sur les stratégies de conception d’un système permettant de relier les images aux métadonnées, et de la pertinence des informations retenues et visibles directement depuis la plateforme. La question des droits reposant sur les photographies de la Société des Nations n’étant pas clairement résolue, il a été décidé de concevoir une plateforme pouvant servir plus largement à d’autres banques d’images de nature similaire.
Samedi 16 septembre 2017
 Découverte : Wikimedia Commons dispose de son propre outil d'annotation : ImageAnnotator. Voir exemple ci-contre.
Code
Organisation
https://github.com/PictureAnnotation
Repositories
https://github.com/PictureAnnotation/Annotation
https://github.com/PictureAnnotation/Annotation-API
Data
Images en ligne sur Wikimedia Commons avec identification basique pour tests :
A (1939) https://commons.wikimedia.org/wiki/File:League_of_Nations_Commission_075.tif
B (1924-1927) https://commons.wikimedia.org/wiki/File:League_of_Nations_Commission_067.tif
Session 1 (mai 2017)
L'équipe
| Université de Lausanne | United Nations Archives | EPITECH Lyon | Archives d'Etat de Genève |
|---|---|---|---|
| Martin Grandjean martin.grandjean@unil.ch | Blandine Blukacz-Louisfert bblukacz-louisfert@unog.ch | Adam Krim adam.krim@epitech.eu | Anouk Dunant Gonzenbach anouk.dunant-gonzenbach@etat.ge.ch |
| Colin Wells cwells@unog.ch | Louis Schneider louis.schneider@epitech.eu | ||
| Maria Jose Lloret mjlloret@unog.ch | Adrien Bayles adrien.bayles@epitech.eu | ||
| Paul Varé paul.vare@epitech.eu |

Ce projet fait partie du Geneva Open Libraries Hackathon.
Compte-Rendu
Vendredi 12 mai 2017
Lancement du hackathon Geneva Open Libraries à la Bibliothèque de l'ONU (présentation du week-end, pitch d'idées de projets, …)
Premières idées de projets:
- Site avec tags collaboratifs pour permettre l'identification des personnes sur des photos d'archives.
- Identification des personnages sur des photos d'archives de manière automatisée.
→ Identifier automatiquement toutes les photos où se situe la même personne et permettre l'édition manuelle de tags qui s'appliqueront sur toutes les photos du personnage (plus besoin d'identifier photo par photo les personnages photographiés).
Samedi 13 mai 2017
Idéalisation du projet: que peut-on faire de plus pour que le projet ne soit pas qu'un simple plugin d'identification ? Que peut-on apporter de novateur dans la recherche collaborative ? Que peut-on faire de plus que Wikipédia ?
Travailler sur la photo, la manière dont les données sont montrées à l'utilisateur, etc…
Problématique de notre projet: permettre une collaboration sur l'identification de photos d'archives avec une partie automatisée et une partie communautaire et manuelle.
Analyser les photos → Identifier les personnages → Afficher la photo sur un site avec tous les personnages marqués ainsi que tous les liens et notes en rapports.
Utilisateur → Création de tags sur la photographie (objets, scènes, liens historiques, etc..) → Approbation de la communauté de l'exactitude des tags proposés.
Travail en cours sur le P.O.C.:
- Front du site: partie graphique du site, survol des éléments…
- Prototype de reconnaissance faciale: quelques défauts à corriger, exportation des visages…
- Poster du projet
Dimanche 14 mai 2017
Le projet ayant été sélectionné pour représenter le hackathon Geneva Open Libraries lors de la cérémonie de clôture de l'Open Geneva Hackathons (un projet pour chacun des hackathons se tenant à Genève ce week-end), il est présenté sur la scène du Campus Biotech.
Data
Poster Genève - Mai 2017
Version PDF grande taille disponible ici. Version PNG pour le web ci-dessous.

Poster Lausanne - Sepembre 2017
Version PNG

Code
Jung - Rilke Correspondance Network

Joint project bringing together three separate projects: Rilke correspondance, Jung correspondance and ETH Library.
Objectives:
-
agree on a common metadata structure for correspondence datasets
-
clean and enrich the existing datasets
-
build a database that can can be used not just by these two projects but others as well, and that works well with visualisation software in order to see correspondance networks
-
experiment with existing visualization tools
Data
ACTUAL INPUT DATA
-
For Jung correspondance: https://opendata.swiss/dataset/c-g-jung-correspondence (three files)
-
For Rilke correspondance: https://opendata.swiss/en/dataset/handschriften-rainer-maria-rilke (two files, images and meta data)
Comment: The Rilke data is cleaner than the Jung data. Some cleaning needed to make them match:
1) separate sender and receiver; clean up and cluster (OpenRefine)
2) clean up dates and put in a format that IT developpers need (Perl)
3) clean up placenames and match to geolocators (Dariah-DE)
4) match senders and receivers to Wikidata where possible (Openrefine, problem with volume)
METADATA STRUCTURE
The follwing fields were included in the common basic data structure:
sysID; callNo; titel; sender; senderID; recipient; recipientID; place; placeLat; placeLong; datefrom, dateto; language
DATA CLEANSING AND ENRICHMENT
* Description of steps, and issues, in Process (please correct and refine).
Issues with the Jung correspondence is data structure. Sender and recipient in one column.
Also dates need both cleaning for consistency (e.g. removal of “ca.”) and transformation to meet developper specs. (Basil using Perl scripts)
For geocoding the placenames: OpenRefine was used for the normalization of the placenames and DARIAH GeoBrowser for the actual geocoding (there were some issues with handling large files). Tests with OpenRefine in combination with Open Street View were done as well.
The C.G. Jung dataset contains sending locations information for 16,619 out of 32,127 letters; 10,271 places were georeferenced. In the Rilke dataset all the sending location were georeferenced.
For matching senders and recipients to Wikidata Q-codes, OpenRefine was used. Issues encountered with large files and with recovering Q codes after successful matching, as well as need of scholarly expertise to ID people without clear identification. Specialist knowledge needed. Wikidata Q codes that Openrefine linked to seem to have disappeared? Instructions on how to add the Q codes are here https://github.com/OpenRefine/OpenRefine/wiki/reconciliation.
Doing this all at once poses some project management challenges, since several people may be working on same files to clean different data. Need to integrate all files.
DATA after cleaning:
https://github.com/basimar/hackathon17_jungrilke
DATABASE
Issues with the target database:
Fields defined, SQL databases and visuablisation program being evaluated.
How - and whether - to integrate with WIkidata still not clear.
Issues: letters are too detailed to be imported as Wikidata items, although it looks like the senders and recipients have the notability and networks to make it worthwhile. Trying to keep options open.
As IT guys are building the database to be used with the visualization tool, data is being cleaned and Q codes are being extracted.
They took the cleaned CVS files, converted to SQL, then JSON.
Additional issues encountered:
- Visualization: three tools are being tested: 1) Paladio (Stanford) concerns about limits on large files? 2) Viseyes and 3) Gephi.
- Ensuring that the files from different projects respect same structure in final, cleaned-up versions.
Visualization (examples)
Heatmap of Rainer Maria Rilke’s correspondence (visualized with Google Fusion Tables)
Correspondence from and to C. G. Jung visualized as a network. The two large nodes are Carl Gustav Jung (below) and his secretary’s office (above). Visualized with the tool Gephi
Team
-
Flor Méchain (Wikimedia CH): working on cleaning and matching with Wikidata Q codes using OpenRefine.
-
Lena Heizman (Dodis / histHub): Mentoring with OpenRefine.
-
Hugo Martin
-
Samantha Weiss
-
Michael Gasser (Archives, ETH Library): provider of the dataset C. G. Jung correspondence
-
Irina Schubert
-
Sylvie Béguelin
-
Basil Marti
-
Jérome Zbinden
-
Deborah Kyburz
-
Paul Varé
-
Laurel Zuckerman
-
Christiane Sibille (Dodis / histHub)
-
Adrien Zemma
-
Dominik Sievi wdparis2017
Schauspielhaus Zürich performances in Wikidata

The goal of the project is to try to ingest all performances of the Schauspielhaus Theater in Zurich held between 1938 and 1968 in Wikidata. In a further step, data from the www.performing-arts.eu Platform, Swiss Theatre Collection and other data providers could be ingested as well.
Data
Tools
-
OpenRefine to clean and reconcile data with wikidata
-
Wikidata Quick Statements to add new items to wikidata
-
Wikidata Quick Statements 2 Beta to add new items to wikidata in batch mode
References
Methodology
-
load data in OpenRefine
-
Column after column (starting with the easier ones) :
-
reconcile against wikidata
-
manually match entries that matched multiple entries in wikidata
-
find out what items are missing in wikidata
-
load them in wikidata using quick statements (quick statements 2 allow you to retrieve the Q numbers of the newly created items)
-
reconcile again in OpenRefine
-
Results
-
Code to transform csv into quick statements : https://github.com/j4lib/performing-arts/blob/master/create_quick_statements.php
Screenshots
Raw Data
Reconcile in OpenRefine
Choose corresponding type
Manually match multiple matches
Import in Wikidata with quick statements
-
Len : english label
-
P31 : instance of
-
Q5 : human
-
P106 : occupation
-
Q1323191 : costume designer
Step 3 (you can get the Q number from there)
Team
-
Renate Albrecher
-
Julia Beck
-
Flor Méchain
-
Beat Estermann
-
Birk Weiberg
-
Lionel Walter
Swiss Video Game Directory

This projects aims at providing a directory of Swiss Video Games and metadata about them.
The directory is a platform to display and promote Swiss Games for publishers, journalists, politicians or potential buyers, as well as a database aimed at the game developers community and scientific researchers.
Our work is the continuation of a project initiated at the 1st Open Data Hackathon in 2015 in Bern by David Stark.
Output
Workflow
-
An open spreadsheet contains the data with around 300 entries describing the games.
-
Every once in a while, data are exported into the Directory website (not publicly available yet).
-
At any moment, game devs or volunteer editors can edit the spreadsheet and add games or correct informations.
Data
The list was created on Aug. 11 2014 by David Javet, game designer and PhD student at UNIL. He then opened it to the Swiss game dev community which collaboratively fed it. At the start of this hackathon, the list was composed of 241 games, starting from 2004. It was turned into an open data set on the opendata.swiss portal by Oleg Lavrovsky.
Source
Team
-
Karine Delvert
-
Selim Krichane
-
Isaac Pante
-
David Stark (team leader)
More
Big Data Analytics (bibliographical data)

We try to analyse bibliographical data using big data technology (flink, elasticsearch, metafacture).
Here a first sketch of what we're aiming at:
Datasets
We use bibliographical metadata:
Swissbib bibliographical data https://www.swissbib.ch/
-
Catalog of all the Swiss University Libraries, the Swiss National Library, etc.
-
960 Libraries / 23 repositories (Bibliotheksverbunde)
-
ca. 30 Mio records
-
MARC21 XML Format
-
→ raw data stored in Mongo DB
-
→ transformed and clustered data stored in CBS (central library system)
-
Institutional Repository der Universität Basel (Dokumentenserver, Open Access Publications)
-
ca. 50'000 records
-
JSON File
crossref https://www.crossref.org/
-
Digital Object Identifier (DOI) Registration Agency
-
ca. 90 Mio records (we only use 30 Mio)
-
JSON scraped from API
Use Cases
Swissbib
Librarian:
- For prioritizing which of our holdings should be digitized most urgently, I want to know which of our holdings are nowhere else to be found.
- We would like to have a list of all the DVDs in swissbib.
- What is special about the holdings of some library/institution? Profile?
Data analyst:
- I want to get to know better my data. And be faster.
→ e.g. I want to know which records don‘t have any entry for ‚year of publication‘. I want to analyze, if these records should be sent through the merging process of CBS. Therefore I also want to know, if these records contain other ‚relevant‘ fields, defined by CBS (e.g. ISBN, etc.). To analyze the results, a visualization tool might be useful.
edoc
Goal: Enrichment. I want to add missing identifiers (e.g. DOIs, ORCID, funder IDs) to the edoc dataset.
→ Match the two datasets by author and title
→ Quality of the matches? (score)
Tools
elasticsearch https://www.elastic.co/de/
JAVA based search engine, results exported in JSON
Flink https://flink.apache.org/
open-source stream processing framework
Metafacture https://culturegraph.github.io/,
https://github.com/dataramblers/hackathon17/wiki#metafacture
Tool suite for metadata-processing and transformation
Zeppelin https://zeppelin.apache.org/
Visualisation of the results
How to get there
Usecase 1: Swissbib
Usecase 2: edoc
Links
Data Ramblers Project Wiki https://github.com/dataramblers/hackathon17/wiki
Team
-
Data Ramblers https://github.com/dataramblers
-
Dominique Blaser
-
Jean-Baptiste Genicot
-
Günter Hipler
-
Jacqueline Martinelli
-
Rémy Meja
-
Andrea Notroff
-
Sebastian Schüpbach
-
T
-
Silvia Witzig
Medical History Collection

Finding connections and pathways between book and object collections of the University Institute for History of Medecine and Public Heatlh (Institute of Humanities in Medicine since 2018) of the CHUV.
The project started off with data sets concerning two collections: book collection and object collection, both held by the University Institute for History of Medicine and Public Health in Lausanne. They were metadata of the book collection, and metadata plus photographs of object collection. These collections are inventoried in two different databases, the first one accessible online for patrons and the other not.
The idea was therefore to find a way to offer a glimpse into the objet collection to a broad audience as well as to highlight the areas of convergence between the two collections and thus to enhance the patrimony held by our institution.
Juxtaposing the library classification and the list of categories used to describe the object collection, we have established a table of concordance. The table allowed us to find corresponding sets of items and to develop a prototype of a tool that allows presenting them conjointly: https://medicalhistorycollection.github.io/glam2017/.
Finally, we’ve seized the opportunity and uploaded photographs of about 100 objects on Wikimedia: https://commons.wikimedia.org/wiki/Category:Institut_universitaire_d%27histoire_de_la_m%C3%A9decine_et_de_la_sant%C3%A9_publique.
Data
https://github.com/MedicalHistoryCollection/glam2017/tree/master/data
Team
-
Magdalena Czartoryjska Meier
-
Rae Knowler
-
Arturo Sanchez
-
Roxane Fuschetto
-
Radu Suciu
Old-catholic Church Switzerland Historical Collection

Christkatholische Landeskirche der Schweiz: historische Dokumente
Description
Der sog. “Kulturkampf” (1870-1886) (Auseinandersetzung zwischen dem modernen liberalen Rechtsstaat und der römisch-katholischen Kirche, die die verfassungsmässig garantierte Glaubens- und Gewissensfreiheit so nicht akzeptieren wollte) wurde in der Schweiz besonders heftig ausgefochten.
Ausgewählte Dokumente in den Archiven der christkatholischen Landeskirche bilden diese interessante Phase zwischen 1870 und 1886/1900 exemplarisch ab. Als lokale Fallstudie (eine Kirchgemeinde wechselt von der römisch-katholischen zur christkatholischen Konfession) werden in der Kollektion die Protokolle der Kirchgemeinde Aarau (1868-1890) gemeinfrei publiziert (CC-BY Lizenz). Dazu werden die digitalisierten Zeitschriften seit 1873 aus der Westschweiz publiziert. Die entsprechenden Dokumente wurden von den Archivträgern (Eigner) zur gemeinfreien Nutzung offiziell genehmigt und freigegeben. Allfällige Urheberrechte sind abgelaufen (70 Jahre) mit Ausnahme von wenigen kirchlichen Zeitschriften, die aber sowieso Öffentlichkeitscharakter haben.
Zielpublikum sind Historiker und Theologen sowie andere Interessierte aus Bildungsinstitutionen. Diese OpenData Kollektion soll andere christkatholische Gemeinden ermutigen weitere Quellen aus der Zeit des Kulturkampfes zu digitalisieren und zugänglich zu machen.
Overview
Bestände deutsche Schweiz :
• Kirchgemeinde Aarau
-
Protokolle Kirchgemeinderat 1868-1890
-
Monographie (1900) : Xaver Fischer : Abriss der Geschichte der katholischen (christkatholischen) Kirchgemeinde Aarau 1806-1895
Fonds Suisse Romande:
• Journaux 1873-2016
-
Le Vieux-Catholique 1873
-
Le Catholique-Suisse 1873-1875
-
Le Catholique National 1876-1878
-
Le Libéral 1878-1879
-
La Fraternité 1883-1884
-
Le Catholique National 1891-1908
-
Le Sillon de Genève 1909-1910
-
Le Sillon 1911-1970
-
Présence 1971-2016
• Canton de Neuchâtel
-
Le Buis 1932-2016
• Paroisse Catholique-Chrétienne de Genève: St.Germain (not yet published)
-
Répertoire des archives (1874-1960)
-
Conseil Supérieur - Arrêtés - 16 mai 1874 au 3 septembre 1875
-
Conseil Supérieur Président - Correspondence - 2 janv 1875 - 9 sept 1876
The data will be hosted on christkatholisch.ch; the publication date will be communicated. Prior to this the entry (national register) on opendata.swiss must be available and approved.
Data
* Présence (2007-2016): http://www.catholique-chretien.ch/publica/archives.php
Team
Swiss Social Archives - Wikidata entity match

Match linked persons of the media database of the Swiss Social Archives with Wikidata.
Data
-
Metadata of the media database of the Swiss Social Archives
Team
Hacking Gutenberg: A Moveable Type Game

The internet and the world wide web are often referred to as being disruptive. In fact, every new technology has a disruptive potential. 550 years ago the invention of the modern printing technology by Johannes Gutenberg in Germany (and, two decades later, by William Caxton in England) was massively disruptive. Books, carefully bound manuscripts written and copied by scribes during weeks, if not months, could suddenly be mass-produced at an incredible speed. As such the invention of moveable types, along with other basic book printing technologies, had a huge impact on science and society.
And yet, 15th century typographers were not only businessmen, they were artists as well. Early printing fonts reflect their artistic past rather than their industrial potential. The font design of 15th century types is quite obviously based on their handwritten predecessors. A new book, although produced by means of a new technology, was meant to be what books had been for centuries: precious documents, often decorated with magnificent illustrations. (Incunables – books printed before 1500 – often show a blank square in the upper left corner of a page so that illustrators could manually add artful initials after the printing process.)
Memory, also known as Match or Pairs, is a simple concentration game. Gutenberg Memory is an HTML 5 adaptation of the common tile-matching game. It can be played online and works on any device with a web browser. By concentrating on the tiles in order to remember their position the player is forced to focus on 15th (or early 16th) century typography and thus will discover the ageless elegance of the ancient letters.
Gutenberg Memory, Screenshot
Johannes Gutenberg: Biblia latina, part 2, fol. 36
Gutenberg Memory comes with 40 cards (hence 20 pairs) of syllables or letter combinations. The letters are taken from high resolution scans (>800 dpi) of late medieval book pages digitized by the university library of Basel. Given the original game with its 52 cards (26 pairs), Gutenberg Memory has been slightly simplified. Nevertheless it is rather hard to play as the player's visual orientation is constrained by the cards' typographic resemblance.
In addition, the background canvas shows a geographical map of Europe visualizing the place of printing. Basic bibliographic informations are given in the caption below, including a link to the original scan.
Instructions
Click on the cards in order to turn them face up. If two of them are identical, they will remain open, otherwise they will turn face down again. A counter indicates the number of moves you have made so far. You win the game as soon as you have successfully found all the pairs. Clicking (or tapping) on the congratulations banner, the close button or the restart button in the upper right corner will reshuffle the game and proceed to a different font, the origin of which will be displayed underneath.
Updates
2017/09/15 v1.0: Prototype, basic game engine (5 fonts)
2017/09/16 v2.0: Background visualization (place of printing)
2017/09/19 v2.1: Minor fixes
Data
-
Wikimedia Commons, 42-zeilige Gutenbergbibel, Teil 2, Blatt 36, Mainz, 1454-1455
-
Wikimedia Commons, 42-zeilige Gutenbergbibel, Teil 2, Blatt 35, Detail
-
Wikimedia Commons, Adam Petri, Martin Luther, Das Alte Testament deutsch, Basel, 1523-1525
-
Wikimedia Commons, Aldus Manutius, Horatius Flaccus, Opera, Venedig, 1501
-
Wikimedia Commons, Johannes Amerbach, Johannes Marius Philelphus, Epistolarium novum, Basel, 1486
-
Wikimedia Commons, Hieronymus Andreae, Albrecht Dürer, Underweysung der messung mit dem zirckel, Nürnberg 1525
Team
Elias Kreyenbühl (left), Thomas Weibel at the «Génopode» building on the University of Lausanne campus.
-
Prof. Thomas Weibel, Thomas Weibel Multi & Media, University of Applied Sciences Chur
-
Dr. des. Elias Kreyenbühl, University Library of Basel
OpenGuesser

This is a game about guessing and learning about geography through images and maps, made with Swisstopo's online maps of Switzerland. For several years this game was developed as open source, part of a series of GeoAdmin StoryMaps: you can try the original SwissGuesser game here, based on a dataset from the Swiss Federal Archives now hosted at Opendata.swiss.
The new version puts your orienteering of Swiss museums to the test.
Demo: OpenGuesser Demo
Encouraged by an excellent Wikidata workshop (slides) at #GLAMhack 2017, we are testing a new dataset of Swiss museums, their locations and photos, obtained via the Wikidata Linked Data endpoint (see app/data/*.sparql in the source). Visit this Wikidata Query for a preview of the first 10 results. This opens the possibility of connecting other sources, such as datasets tagged 'glam' on Opendata.swiss, and creating more custom games based on this engine.
We play-tested, revisited the data, then forked and started a refresh of the project. All libraries were updated, and we got rid of the old data loading mechanism, with the goal of connecting (later in real time) to open data sources. A bunch of improvement ideas are already proposed, and we would be glad to see more ideas and any contributions: please raise an Issue or Pull Request on GitHub if you're so inclined!
Data
-
GeoAdmin API via OpenLayers
Team
-
@pa_fonta
Wikidata Ontology Explorer

A small tool to get a quick feeling of an ontology on Wikidata.
Data
(None, but hopefully this helps you do stuff with your data :) )
Team
Dario Donati (Swiss National Museum) & Beat Estermann (Opendata.ch)
New Frontiers in Graph Queries
We begin with the observation that a typical SPARQL endpoint is not friendly in the eyes of an average user. Typical users of cultural databases include researchers in the humanities, museum professionals and the general public. Few of these people have any coding experience and few would feel comfortable translating their questions into a SPARQL query.
Moreover, the majority of the users expect searches of online collections to take something like the form of a regular Google search (names, a few words, or at the top end Boolean operators). This approach to search does not make use of the full potential of the graph-type databases that typically make SPARQL endpoints available. It simply does not occur to an average user to ask the database a query of the type “show me all book authors whose children or grandchildren were artists.”
The extensive possibilities that are offered by graph databases to researchers in the humanities go unexplored because of a lack of awareness of their capabilities and a shortage of information about how to exploit them. Even those academics who understand the potential of these resources and have some experience in using them, it is often difficult to get an overview of the semantics of complex datasets.
We therefore set out to develop a tool that:
-
simplifies the entry point of a SPARQL query into a form that is accessible to any user
-
opens ways to increase the awareness of users about the possibilities for querying graph databases
-
moves away from purely text-based searches to interfaces that are more visual
-
gives an overview to a user of what kinds of nodes and relations are available in a database
-
makes it possible to explore the data in a graphical way
-
makes it possible to formulate fundamentally new questions
-
makes it possible to work with the data in new ways
-
can eventually be applied to any SPARQL endpoint
Data
Wikidata
Team
-
Loïc Jaouen loic.jaouen@unil.ch
-
(Elena Chestnova elena.chestnova@usi.ch)
Sex and Crime und Kneippenschlägereien in Early Modern Zurich
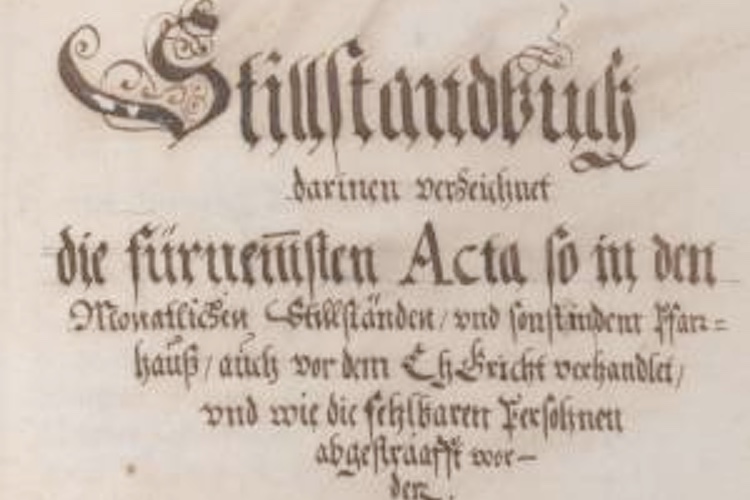
Minutes reported by pastor in Early Modern Zurich.
Make the “Stillstandsprotokolle” searchable, georeferenced and browsable and display them on a map.
For more Info see our Github Repository
Access the documents: archives-quickaccess.ch/search/stazh/stpzh
Data
-
Primary Data
-
Secondary data
-
Siedlungsverzeichnis des Kantons Zürich: http://www.web.statistik.zh.ch/cms_siedlungsverzeichnis/daten.php
-
Team
-
Ernst Rosser, ernst.rosser@gmail.com
-
Tobias Hodel, tobias.hodel@ji.zh.ch
-
Barbara Leimgruber, Barbara.Leimgruber@ji.zh.ch
-
Rebekka Plüss, Rebekka.Pluess@ji.zh.ch
-
Ismail Prada, ismail.prada@gmail.com
-
Matthias Mazenauer, matthias.mazenauer@statistik.ji.zh.ch
Wikidata-based multilingual library search
In Switzerland each linguistic region is working with different authority files for authors and organizations, situation which brings difficulties for the end user when he is doing a search.
Goal of the Hackathon: work on a innovative solution as the library landscape search platforms will change in next years.
Possible solution: Multilingual Entity File which links to GND, BnF, ICCU Authority files and Wikidata to bring end user information about authors in the language he wants.
Steps:
-
analyse coverage by wikidata of the RERO authority file (20-30%)
-
testing approach to load some RERO authorities in wikidata (learn process)
-
create an intermediate process using GND ID to get description information and wikidata ID
-
from wikidata get the others identifiers (BnF, RERO,etc)
-
analyse which element from the GND are in wikidata, same for BnF, VIAF and ICCU
-
create a multilingual search prototype (based on Swissbib model)
Data

Number of ID in VIAF
-
BNF: 4847978
-
GND: 8922043
-
RERO: 255779
Number of ID in Wikidata from
-
BNF: 432273
-
GND: 693381
-
RERO: 2145
-
ICCU: 30047
-
VIAF: 1319031 (many duplicates: a WD-entity can have more than one VIAF ID)
Query model:
wikidata item with rero id
#All items with a property
# Sample to query all values of a property
# Property talk pages on Wikidata include basic queries adapted to each
property
SELECT
   ?item ?itemLabel
   ?value ?valueLabel
# valueLabel is only useful for properties with item-datatype
WHERE
{
   ?item wdt:P3065 ?value
   # change P1800 to another property
   SERVICE wikibase:label { bd:serviceParam wikibase:language
"[AUTO_LANGUAGE],en". }
}
# remove or change limit for more results
LIMIT 10000
Email from the GND :
There is currently no process that guarantees 100% coverage of GND entities in wikibase. The existing links between wikibase and GND entries come mostly from manually edited Wikipedia entries.
User Interface
There are several different target users: the librarians who currently use all kinds of different systems and the end user, who wants to search for information or to locate a book in a nearby library.
Librarian: The question of process is the key challenge concerning the librarian user. At present some Swiss librarians create authority records and some don't. New rules and processes for creating authority files in GND , BNF, etc will change their work methods. The process of creating local Swiss authority files will be entirely revamped. Fragmented Swiss regional authority files will disappear, and be replaced by either the German, French, Italian, American etc national authority files or by direct creation in Wikidata by the local librarian. (Wikidata will serve as central repository for all autority IDs).
End User
The model for the multilingual user interface is SwissBib, the “catalog of Swiss univerity libraries, the Swiss national library, several cantonal libraries and other institutions”. The objective is to keep the look and functionalities of the existing website, which includes multilingual display of labels in English, French, German and Italian.
What changes is the source of information about the author which will in the future be taken from the BNF for French, the GNB for German, and LCCN for English. (In the proof of concept pilot, only the author name will be concerned.)
The list of books and libraries will continue to function as before, with no changes.
In the full project, several pages must be modified:
* The search page (example with Joel Dicker): https://www.swissbib.ch/Search/Results?lookfor=joel+dicker&type=AllFields
* The Advanced search page https://www.swissbib.ch/Search/Advanced
* The Record Page: https://www.swissbib.ch/Record/48096257X
The Proof on Concept project will focus exclusively on the basic search page.
Open issues
The issue of key words remains open (at present they are from DNB, which works for German and English, but does not work for French)
The question of an author photo and a bio is open. At present very few authors have a short bio paragraph associated with their names. Should each author have a photo and bio? If so, where to put it on the page?
Other design question: Should the selection of the language of the book be moved up on the page?
Prototype
(Translations from Wikidata into French)
1. Schweizerisches Landesmuseum
http://feature.swissbib.ch/Record/110393589

2. Wikimedia Foundation
http://feature.swissbib.ch/Record/070092974

3. Chocoladefabriken Lindt & Sprüngli AG
http://feature.swissbib.ch/Record/279360789
ATTENTION: Multiple authors

4. Verband schweizerischer Antiquare und Kunsthändler
ATTENTION: NO French label in Wikidata
http://feature.swissbib.ch/Record/107734591

Methods
Way of getting BNF records via SRU from Wikidata
http://catalogue.bnf.fr/api/SRU?version=1.2&operation=searchRetrieve&query=aut.ark%20all%20%22ark:/12148/cb118806093%22&recordSchema=unimarcxchange&maximumRecords=20&startRecord=1
Instruction: add prefix “ark:/12148/cb” to BNF ID in order to obtain the ARK ID
Lookup Qcode from GND ID
SELECT DISTINCT ?item ?itemLabel  WHERE {
  ?item wdt:P227 "1027690041".
  SERVICE wikibase:label { bd:serviceParam wikibase:language "en". }
}
Integration of RERO person/organisation data into Wikidata
Methodology
4 cases
1. RERO authorities are in Wikidata with RERO ID
-
2145 items
2. RERO authorities are in Wikidata without RERO ID but with VIAF ID
-
1316347 items (without deduplication)
-
add only ID possibles (PetScan)
3. RERO authorities are in Wikidata without RERO or VIAF ID
-
reconcialiation with OpenRefine
4. RERO authorities are not in Wikidata
-
Quickstatements or mass import
Demo / Code / Final presentation
-
Demo http://feature.swissbib.ch/Record/317008587 and you can search other records
-
Final presentation : presentation.pdf
Team
-
Elena Gretillat
-
Nicolas Prongué
-
Lionel Walter
-
Laurel Zuckerman
-
Jacqueline Martinelli
Zurich Historical Photo Tours

We would like to enable our users to discover historical pictures of Zürich and go to the places where they were taken. They can take the perspective of the photographer from around 100 years ago and see how the places have changed. They can also share their photographs with the community.
We have planned two thematic tours, one with historical photographs of Adolphe Braun and one with photographs connected to the subject of silk fabrication. The tour is enhanced with some historical information.
In the collections of the ETH, Baugeschichtliches Archiv, and Zentralbibliothek Zurich, Graphische Sammlung, we found pictures to match the topics above and to set up a nice tour for the users.
In a second step we went to the actual spots to verify if the pictures could be taken and to find out the exact geodata.
Meanwhile, our programmers inserted the photographer's stops on a map. As soon as the users reach the proximity of the spot, their phone will start vibrating. At this point, the historical photo will show up and the task is to search for the right angle from where the historical photograph has been taken. At this point, the users are asked to take their own picture. The app allows the users to overlay the historical with the current picture so a comparison can be made. The user is provided by additional information like the name of the photographer of the historical picture, links to the collection the picture comes from, the building itself, connection to the silk industry etc.
Here is the link to our prototype: https://glamhistorytour.github.io/HistoryTourApp/
Data
-
Open images from http://ba.e-pics.ethz.ch/#1540897299565_1|E-Pics
-
Open images from https://www.e-manuscripta.ch/
-
Open images from https://www.silkmemory.ch/
-
Open images from https://opendata.swiss/dataset/vues-de-la-suisse
Team
-
Maya Beer
-
Rafael Arizcorreta
-
Tina Tomovic
-
Annabelle Wiegart
-
Lothar Schmitt
-
Thomas Bochet
-
Marina Petrova
-
Kenny Floria
Ask the Artist
The project idea is to create a voice assistance with the identity of an artist. In our case, we created a demo of the famous Swiss painter Ferdinand Hodler. That is to say, the voice assistance is nor Siri nor Alexa. Instead, it is an avatar of Ferdinand Hodler who can answer your questions about his art and his life.
You can directly interact with the program by talking, as what you would do normally in your daily life. You can ask it all kinds of questions about Ferdinand Hodler, e.g.:
-
When did you start painting?
-
Who taught you painting?
-
Can you show me some of your paintings?
-
Where can I find an exhibition with your artworks?
By talking to the digital image of the artist directly, we aim to bring the art closer to people's daily life, in a direct, intuitive and hopefully interesting way.
As you know, museum audiences need to keep quiet which is not so friendly to children. Also, for people with special needs, like the visually dispaired, and people without professional knowledge about art, it is not easy for them to enjoy the museum visit. To make art accessible to more people, a voice assistance can help with solving those barriers.
If you asked the difference between our product with Amazon's Alexa or Apple's Siri, there are two major points:
-
The user can interact with the artist in a direct way: talking to each other. In other applications, the communication happened by Alexa or Siri to deliver the message as the 3rd party channel. In our case, users can have immersive and better user experienceand they will feel like if they were talking to an artist friend, not an application.
-
The other difference is that the answers to the questions are preset. The essence of how Alexa or Siri works is that they search the question asked by users online and read the returned search results out. In that case, we cannot make sure that the answer is correct and/or suitable. However, in our case, all the answers are coming from reliable data sets of museum and other research institutions, and have been verified and proofread by the art experts. Thus, we can proudly say, the answers from us are reliable and correct. People can use it as a tool to educate children or as visiting assistance in the exhibition.
Data
-
List and link your actual and ideal data sources.
-
Kunsthaus Zürich
⭐️ List of all Exhibitions at Kunsthaus Zürich
-
SIK-ISEA
⭐️ Artist data from the SIKART Lexicon on art in Switzerland
-
Swiss National Museum
⭐️ Representative sample from the Paintings & Sculptures Collection (images and metadata)
-
Wikimedia Switzerland
Team
-
Angelica
-
Barbara
-
Anlin (lianganlin@foxmail.com)
Artify

Explore the collection in a new, interessting way
You have to find objects, which have similar metadata and try to match them. The displayed objects are (semi-)randomly selected from a dataset (eg. from SNM). From the metadata of the starting object, the app will search for three other objects:
-
One which matches in 2+ metadata tags
-
One which matches in 1 metadata tag
-
One which is completly random.
If you choose the right one, the app will display three new objects accordingly to the way explained above.
Tags used from the datasets:
-
OBJEKT Klassifikation (x)
-
OBJEKT Webtext
-
OBJEKT Datierung (x)
-
OBJEKT → Herstellung (x)
-
OBJEKT → Herkunft (x)
(x) = used for matching
To Do
-
Datasets are too divers; in some cases there is no match. Datasets need to be prepared.
-
The tag “Klassifikation” is too specific
-
The tags “Herstellung” and “Herkunft” are often empty or not consistent.
Use case
There are various cases, where the app could be used. It mainly depends on the datasets you use:
-
Explore hidden objects of a museum collection
-
Train students to identify art periods
-
Find connections between museums, which are not obvious (e.g. art and historical objects)
Data
Democase:
SNM
https://opendata.swiss/en/organization/schweizerisches-nationalmuseum-snm
–> Build with two sets: Technologie und Brauchtum / Kutschen & Schlitten & Fahrzeuge
Links
Github: https://github.com/zack17/ocdh2018
Tech. Demo: https://zack17.github.io/ocdh2018/
Design Demo (not functional): https://tempestas.ch/artify/
Team
-
Micha Reiser
-
Jacqueline Martinelli
-
Anastasiya Korotkova
-
Dominic Studer
-
Yaw Lam
Letterjongg
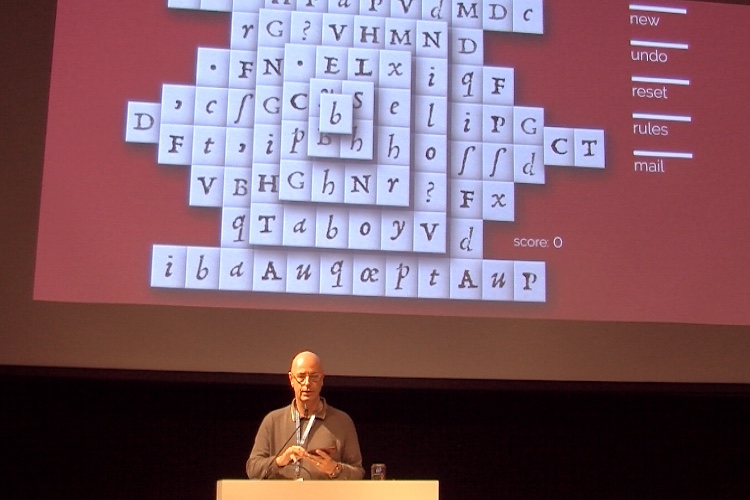
 In 1981 Brodie Lockard, a Stanford University student, developed a computer game just two years after a serious gymnastics accident had almost taken his life and left him paralyzed from the neck down. Unable to use his hands to type on a keyboard, Lockard made a special request during his long recovery in hospital: He asked for a PLATO terminal. PLATO (Programmed Logic for Automatic Teaching Operations) was the first generalized computer-assisted instruction system designed and built by the University of Illinois.
The computer game Lockard started coding on his PLATO terminal was a puzzle game displaying Chinese «Mah-Jongg» tiles, pieces used for the Chinese game that had become increasingly popular in the United States. Lockard accordingly called his game «Mah-Jongg solitaire». In 1986 Activision released the game under the name of «Shanghai» (see screenshot), and when Microsoft decided to add the game to their Windows Entertainment Pack für Win 3.x in 1990 (named «Taipei» for legal reasons) Mah-Jongg Solitaire became one of the world's most popular computer games ever.
Typography
«Letterjongg» aims at translating the ancient far-east Mah-Jongg imagery into late medieval typography. 570 years ago the invention of the modern printing technology by Johannes Gutenberg in Germany (and, two decades later, by William Caxton in England) was massively disruptive. Books, carefully bound manuscripts written and copied by scribes in weeks, if not months, could all of a sudden be mass-produced in a breeze. The invention of moveable types as such, along with other basic book printing technologies, had a huge impact on science and society.
Yet, 15th century typographers were not only businessmen, they were artists as well. Early printing fonts reflect their artistic past. The design of 15th/16th century fonts is still influenced by their calligraphic predecessors. A new book, although produced by means of a new technology, was meant to be what it had been for centuries: a precious document, often decorated with magnificent illustrations. (Incunables – books printed before 1500 – often have a blank space in the upper left corner of a page so that illustrators could manually add artful initials after the printing process.)
Letterjongg comes with 144 typographic tiles (hence 36 tile faces). The letters have been taken and isolated from a high resolution scan (2,576 × 4,840 pixels, file size: 35.69 MB, MIME type: image/tiff) of Aldus Pius Manutius, Horatius Flaccus, Opera (font design by Francesco Griffo, Venice, 1501). «Letterjongg» has been slightly simplified. Nevertheless it is not easy to play as the games are set up at random (actually not every game can be finished) and the player's visual orientation is constrained by the sheer number and resemblance of the tiles.
Letterjongg, Screenshot
Technical
The game is coded in dynamic HTML (HTML 5, CSS 3, Javascript); no external frameworks or libraries were used.
Rules
Starting from the sides, or from the central tile at the top of the pile, remove tiles by clicking on two equal letters. If the tiles are identical, they will disappear, and your score will rise. Removeable tiles always must be free on their left or right side. If a tile sits between two tiles on the same level, it cannot be selected.
Version History
2018/10/26 v0.1: Basic game engine, prototype
2018/10/27 v0.11: Moves counter, about
2018/10/30 v0.2: Matches counter
2018/11/06 v0.21: Animations
Data
-
Wikimedia Commons, Aldus Manutius, Horatius Flaccus, Opera, Venice, 1501
-
Europeana, Quincti Horatii Flacci Poemata omnia, 1629
Team
-
Prof. Thomas Weibel, Thomas Weibel Multi & Media, University of Applied Sciences Chur/Bern University of the Arts
-
Dr. des. Elias Kreyenbühl, University Library of Basel
Walking Around the Globe – 3D Picture Exhibition
With our Hackathon prototype for a virtual 3D exhibition in VR we tackle several challenges.
• The challenge of exhibition space:
many collections, especially small ones – like the Collection of Astronomical Instruments of ETH Zurich – have only a small or no physical space at all to exhibit their objects to the public
• The challenge of exhibiting light-sensitive artworks:
some artworks – especially art on paper – are very sensitive to the light and are in danger of serious damaged when they are permanently exposed. That’s why the Graphische Sammlung ETH Zurich can’t present their treasures in a permanent exhibition to the public
• The challenge of involving the public:
nowadays the visitors do not want to be reduced to be passive consumers, they want and appreciate active involvement
• The challenge of the scale:
in usual 2D digital presentations the user does not get information about the real scale of the artworks and gets wrong ideas about the dimensions
• The challenge of showing 3D objects in the digital space:
many museum databases show only one or two digital images of their 3D objects, so the user gets only a very limited impression
Our Hackathon prototype for a virtual 3D exhibition in VR
• offers unlimited exhibition space in the virtual reality
• makes it possible to exhibit light sensitive artworks permanently using their digital reproductions
• involves the public inviting them to slip into the role of the curator
• shows the artwork in the correct scale
• and gives the users the opportunity to walk around the 3D objects in the virtual space
A representative screenshot:

We unveil a window into a future where you can create, curate and experience virtual 3D expositions in VR.
We showcase a first exposition with a 3D-Model of a globe like in the Collection of Astronomical Instruments of ETH Zurich as a centerpiece and works of art from the Graphische Sammlung ETH Zurich surrounding it. Users can experience our curated exposition using a state-of-the-Art VR headset, the HTC Vive.
Our vision has massive value for practitioners, educators and students and also opens up the experience of curation to a broader audience. It enables art to truly transcend borders, cultures and economic boundaries.
Project Presentation
You can download the presentation slides: 20181028_glamhack_presentation.pdf.
Project Impressions
On the very first day, we create our data model on paper by ensuring everybody got a chance to present their use cases, stories and needs. 
On Friday evening, we had a first prototype of our VR Environment: 
On Saturday, we created our interim presentation, improved our prototype, curated our exposition, and tried and ditched many ideas.
Saturday evening saw our prototype almost finished! Below a screenshot of two rooms, one curated by experts and the other one containing artificially generated art. 

Our final project status involves a polished prototype with an example exhibition consisting of two rooms:
Walking Around The Globe: A room
curated by art experts, exhibiting a selection of old
masterpieces (15th
century to today).

Style transfer: A room designed by laymen
showing famous paintings & derivates generated by
an artificial intelligence (AI) via a technique called
style transfer.

In the end we even created a mockup of the possible backend ui, the following images are some impressions for it:


Technical Information
Our code is on Github, both the Frontend and the Backend.
We are using Unity with the SteamVR Plugin to deploy on the HTC Vive. This combination means we had to use combinations of C# Scripting (We recommend the excellent Rider Editor), design using the Unity Editor, custom modifications to the SteamVR plugin, do 3d model imports using FastObjImporter and other fun stuff.
Our backend is written in Java and uses MongoDB.
For the style transfer images, we used a open source python code which is available on Github.
Acknowledgments
The Databases and Information Systems Group at the University of Basel is the home of a majority of our project members. Our hardware was borrowed for the weekend from the Gravis Group from Prof. Vetter.
Data
-
Dataset with digital images (jpg) and metadata (xml) from the Collection of Astronomical Instruments of ETH Zurich
-
Graphische Sammlung ETH Zurich, Collection Online, four sample datasets with focus on bodies in the air, portraits, an artist (Rembrandt) and different techniques (printmaking and drawing)
Team
-
Ivan Giangreco, Postdoc @ Databases and Information Systems Group
-
Ralph Gasser, PhD Student @ Databases and Information Systems Group
-
Mahnaz Amiri Parian, PhD Student @ Databases and Information Systems Group
-
Silvan Heller, PhD Student @ Databases and Information Systems Group
-
Loris Sauter, MsC Student @ Computer Science Uni Basel
-
Ann-Kathrin Seyffer @ Graphische Sammlung ETH Zürich
-
Susanne Pollack @ Graphische Sammlung ETH Zürich
-
Agnese Quadri @ ETH Library
-
Donatella Gavrilovich @ University of Rome "Tor Vergata"
We-Art-o-nauts

A better way to experience art:
Build a working, easy to follow example that integrates open and curated culture data with VR devices in a museum exhibition to provide modern, fun and richer visitor experience. Focusing on one art piece, organizing data alone the timeline, building a concept and process, so anyone who want to use above technologies can easily follow the steps for any art object for any museum.
Have a VR device next to the painting, we integrate interesting facts about the painting in a 360 timeline view with voice over. Visitors can simply put it on to use it.
Try the live demo in your browser - works particularly well on mobile phones, and supports Google Cardboard:
Visit the project homepage for more information, and to learn more about the technology and data used.
See also: hackathon presentation (PPTX) | source code (GitHub)
Data
-
“Allianzteppich”, a permanent collection in Landsmuseum
-
Curated data from Dominik Sievi in Landsmuseum
-
Open data sources (WikiData)
Team
Swiss Art Stories on Twitter
In the project “Swiss art stories on Twitter”, the Twitter bot “larthippie” has been created. The idea of the project is to automatically tweet information on Swiss art, artists and exhibitions.
Originally, different storylines for the tweets were discussed and programmed, such as:
- Tweeting information about upcoming exhibitions at Kunsthaus Zürich and reminders with approaching deadlines
- Tweets with specific information about artists, taken from the artists database SIK-ISEA
- Tweeting the exhibition history of Kunsthaus Zürich
- Comparing the images of artworks, created in the same year, held at the same location or showing the same subject
The prototype however has another focus now. It tweets the ownership history (provenance) of artworks. As the the information is scientifically researched, larthipppie provides tweets for art professionals. Therefore the twitter bot is more than a usual social media account, but might become a tool for provenance research. Interested audience has to follow larthippie in order to be updated on new provenance information. As an additional feature, the twitterbot larthippie likes and follows accounts that shares content from Swiss artists.
Followers can message the bot and ask for information about a painting on any artist. In the prototype, it is only possible to query the provenance of artworks by Ferdinand Hodler. In the future, the twitter bot might also tweet newly acquired works in art museums.
You can check the account by the following link:
https://twitter.com/larthippie
Data
-
Swiss Institute for Art Research (SIK-ISEA)
-
Kunsthaus Zürich
-
Swiss National Museum
Team
-
Tugrulcan Elmas, tugrulcanelmas@gmail.com, @tugrulcanelmas
Dog Name Creativity Survey

We started this project to see if art and cultural institutions in the environment have an impact on the creativity of dognames. This was not possible with the date from Zurich because the name-dataset does not contain information about the location and the dataset about the owners does not include the dognames. We choose to stick with our idea but used a different dataset: NYC Dog Licensing Dataset.
The creativity of a name is measured by the frequency of each letter in the English language and gets +/- points according to the amount of dogs with the same name. The data for the cultural environment comes from Wikidata.
After some data-cleaning with OpenRefine and failed attempts with OpenCalc we got the following code:
import string
import pandas as pd

numbers_ = {"e":1,"t":2,"a":3,"o":4,"n":5,"i":6,"s":7,"h":8,"r":9,"l":10,"d":11,"u":12,"c":13,"m":14,"w":15,"y":16,"f":17,"g":18,"p":19,"b":20,"v":21,"k":22,"j":23,"x":24,"q":25,"z":26}
name_list = []

def KreaWert(name_):
    name_ = str(name_)
    wert_ = 0
    for letter in str.lower(name_):
        temp_ = 0
        if letter in string.ascii_lowercase :
            temp_ += numbers_[letter]
            wert_ += temp_
    if name_ in H_:
        wert_ = wert_* ((Hmax-H_[name_])/(Hmax-1)*5 + 0.2)
    return round(wert_,1)

df = pd.read_csv("Vds3.csv", sep = ";")
df["AnimalName"] = df["AnimalName"].str.strip()
H_ = df["AnimalName"].value_counts()
Hmax = max(H_)
Hmin = min(H_)

df["KreaWert"] = df["AnimalName"].map(KreaWert)
df.to_csv("namen2.csv")

dftemp = df[["AnimalName", "KreaWert"]].drop_duplicates().set_index("AnimalName")
dftemp.to_csv("dftemp.csv")

df3 = pd.DataFrame()
df3["amount"] = H_
df3 = df3.join(dftemp, how="outer")
df3.to_csv("data3.csv")

df1 = round(df.groupby("Borough").mean(),2)
df1.to_csv("data1.csv")

df2 = round(df.groupby(["Borough","AnimalGender"]).mean(),2)
df2.to_csv("data2.csv")
Visualisations were made with D3: https://d3js.org/
Data
Hundedaten der Stadt Zürich:
NYC Dog Licensing Dataset:
Team
-
Birk Weiberg
-
Dominik Sievi
VR Visits Zurich

VRV … from Zürich a New York …
Data
Team
-
Leonarda da Vinci Team
Find Me an Exhibit
Are you ready to take up the challenge? Film categories of objects in the exhibition “History of Switzerland” running against the clock.
The app displays one of several categories of exhibits that can be found in the exhibition (like “cloths”, “paintings” or “clocks”). Your job is to find a matching exhibit as quick as possible. You don't have much time, so hurry up!
Best played on portable devices. ![]()
The frontend of the app is based on the game “Emoji Scavenger Hunt”, the model is built with TensorFlow.js fed with a lot of images kindly provided by the National Museum Zurich. The app is in pre-alpha stage.
Data
Team
-
Some data ramblers
View Find (Library Catalog Search)

Team
-
Stefanie Kohler
-
Stephan Gantenbein
Back to the Greek Universe
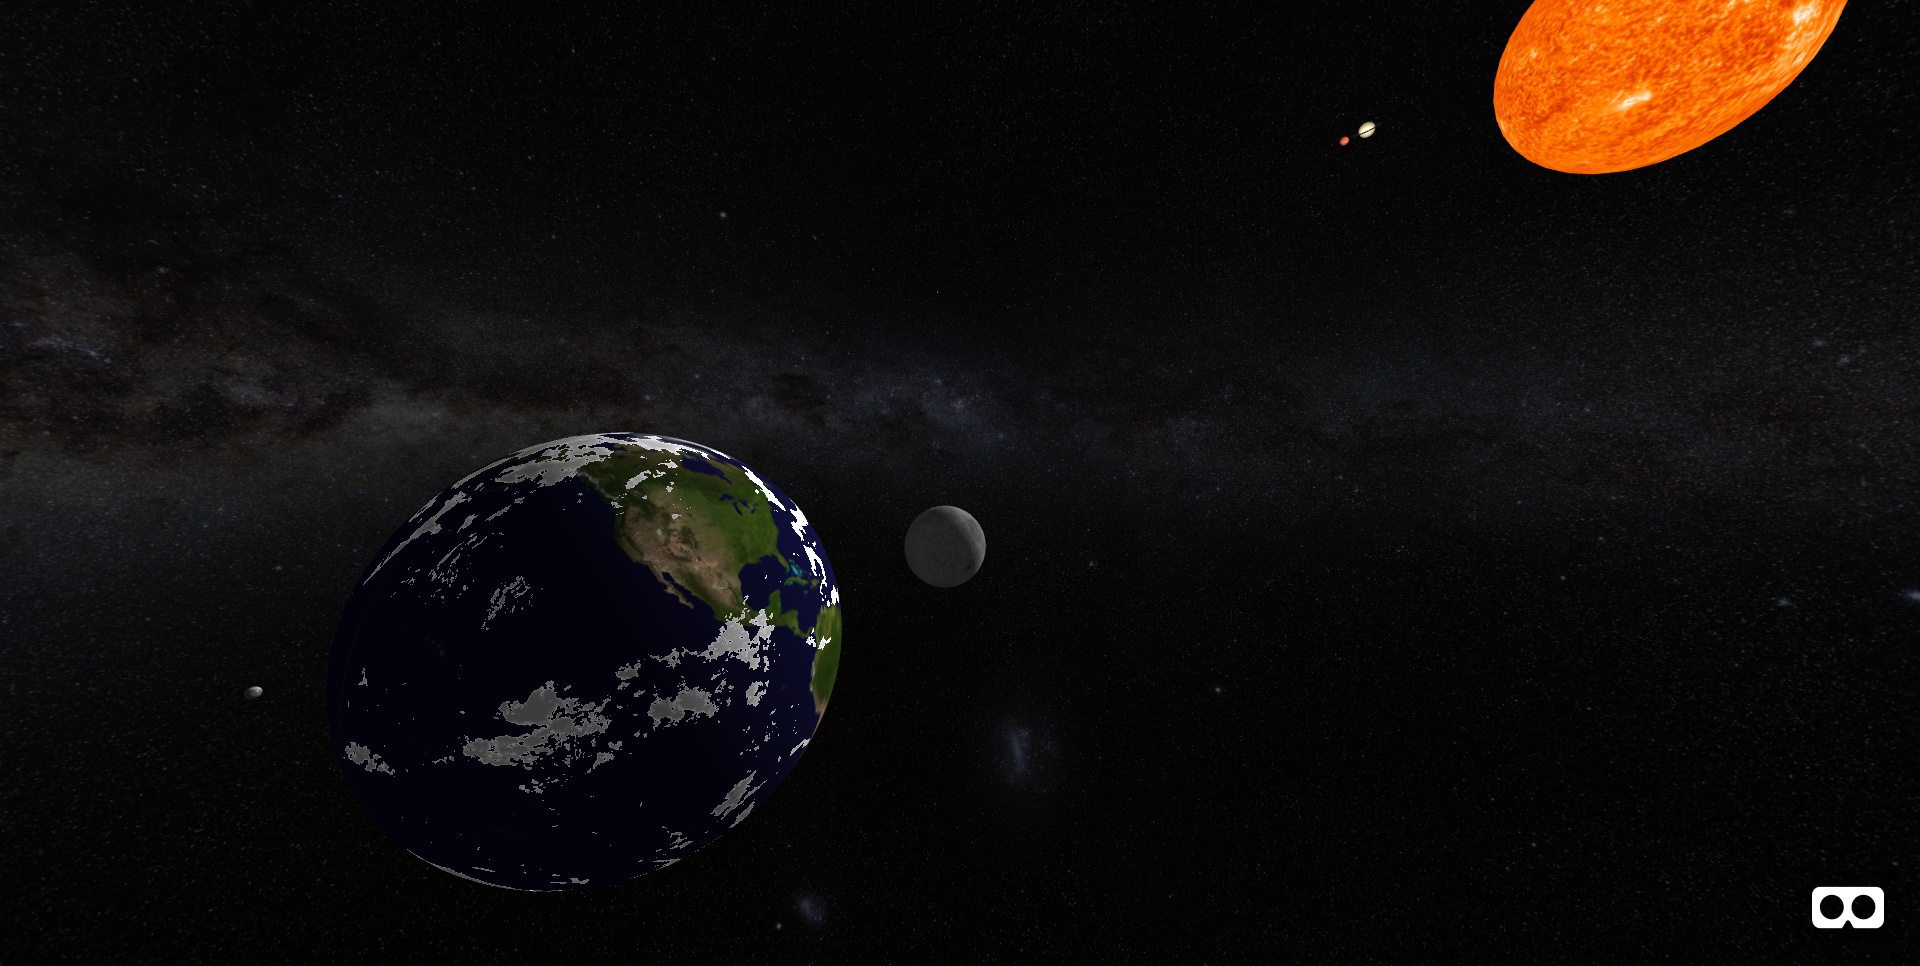
Back to the Greek Universe is a web application that allows users to explore the ancient Greek model of the universe in virtual reality so that they can realize what detailed knowledge the Greeks had of the movement of the celestial bodies observable from the Earth's surface. The model is based on Claudius Ptolemy's work, which is characterized by the fact that it adopts a geo-centric view of the universe with the earth in the center.
Ptolemy placed the planets in the following order:
-
Moon
-
Mercury
-
Venus
-
Sun
-
Mars
-
Jupiter
-
Saturn
-
Fixed stars
 The movements of the celestial bodies as they appear to earthlings are expressed as a series of superposed circular movements (see deferent and epicycle theory), characterized by varying radius and speed. The tabular values that serve as inputs to the model have been extracted from literature.
Claudius Ptolemy (~100-160 AD) was a Greek scientist working at the library of Alexandria. One of his most important works, the «Almagest», sums up the geographic, mathematical and astronomical knowledge of the time. It is the first outline of a coherent system of the universe in the history of mankind.
Back to the Greek Universe is a VR model that rebuilds Ptolemy’s system of the universe on a scale of 1/1 billion. The planets are 100 times larger, the earth rotates 100 times more slowly. The planet orbits periods are 1 million times faster than they would be according to Ptolemy’s calculations.
Back to the Greek Universe was coded and presented at the Swiss Open Cultural Data Hackathon/mix'n'hack 2019 in Sion, Switzerland, from Sept 6-8, 2019, by Thomas Weibel, Cédric Sievi, Pia Viviani and Beat Estermann.
Instructions
 This is how to fly Ptolemy's virtual spaceship:
-
Point your smartphone camera towards the QR code, tap on the popup banner in order to launch into space.
-
Turn around and discover the ancient greek solar system. Follow the planets' epicyclic movements (see above).
-
Tap in order to travel through space, in any direction you like. Every single tap will teleport you roughly 18 million miles forward.
-
Back home: Point your device vertically down and tap in order to teleport back to earth.
-
Gods' view: Point your device vertically up and tap in order to overlook Ptolemy’s system of the universe from high above.
The cockpit on top is a time and distances display: The years and months indicator gives you an idea of how rapidly time goes by in the simulation, the miles indicator will always display your current distance from the earth center (in million nautical miles).
Data
The data used include 16th century prints of Ptolemy's main work, the Almagest (both in greek and latin) and high-resolution surface photos of the planets in Mercator projection. The photos are mapped onto rotating spheres by means of Mozilla's web VR framework A-Frame.

Stars map (milky way) (Creative Commons Attribution 4.0 International)
Primary literature
-
Simon Grynaeus: Kl. Ptolemaiou Megalēs syntaxeōs bibl. 13, public domain
-
Peter Liechtenstein: Almagestum CL. Ptolemei Pheludiensis Alexandrini astronomorum principis opus ingens ac nobile omnes celoru motus continens, public domain
Secondary literature
-
Richard Fitzpatrick: A Modern Almagest, An Updated Version of Ptolemy’s Model of the Solar System
-
John Cramer: The Ptolemaic System, A Detailed Synopsis
-
Astrophysikalisches Institut Neunhof: Das Weltmodell des Ptolemaios
Version history
2019/09/07 v1.0: Basic VR engine, interactive prototype
2019/09/08 v1.01: Cockpit with time and distance indicator
2019/09/13 v1.02: Space flight limited to stars sphere, minor bugfixes
2019/09/17 v1.03: Planet ecliptics adjusted
Team
-
Thomas Weibel (weibelth)
-
Cédric Sievi
-
Pia Viviani (pia)
-
Beat Estermann (beat_estermann)
CoViMAS
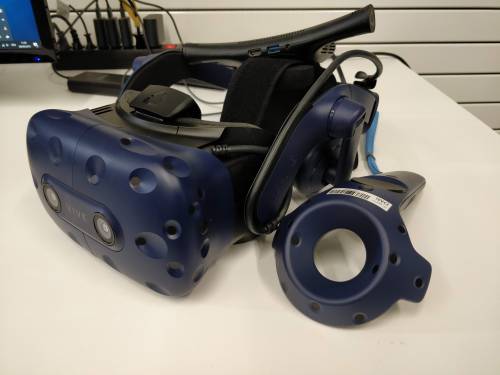
Day One
CoViMAS joins forces of different disciplines to form a group which contains Maker, content provider, developer(s), communicator, designer and user experience expert. Having different backgrounds and expertise made a great opportunity to explore different ideas and opportunities to develop the horizons of the project.
Two vital components of this project is Virtual Reality headset and Datasets which are going to be used. HTC Vive Pro VR headsets are converted to wireless mode after our last experiment which prove the freedom of movement without wires attached to the user, increases the user experience and feasibility of usage.
Our team content provider and designer spent invaluable amount of time to search for the representative postcards and audio which can be integrated in the virtual space and have the potential to improve the virtual reality experience by adding extra senses. This includes selecting postcards which can be touched and seen in virtual and non-virtual reality. Additionally, to improve the experience, and idea of hearing a sound which is related to the picture being viewed popped up. This audio should have a correlation with the picture being viewed and recreate the sensation of the picture environment for the user in virtual world.
To integrate the modern methods of Image manipulation through artificial Intelligence, we tried using Deep Learning method to colorize the gray-scale images of the “otografien aus dem Wallis von Charles Rieder”. The colored images allow the visitor get a more sensible feeling of the pictures he/she is viewing. The initial implementation of the algorithm showed the challenges we face, for example the faded parts of the pictures or scratched images could not very well be colorized.
Day Two
Although the VR exhibition is taken from our previous participation in Glamhack2018, the exhibition needed to be adjusted to the new content. We have designed the rooms to showcase the dataset “Postkarten aus dem Wallis (1890-1950)”. at this point, the selected postcards to be enriched with additional senses are sent to the Fablab, to create a haptic card and a feather pallet which is needed to be used alongside one postcard which represent a goose.
the fabricated elements of our exhibition get attached to a tracker which can be seen through VR glasses and this allows the user to be aware of location of the object, and sense it.
The Colorization improved through the day, by some alteration in training setup and the parameters used to tune the images. The results at this stage are relatively good.
And the VR exhibition hall is adjusted to be automatically load images from postcards and also the colorized images alongside their original color.
And late night, when finalizing the works for the next day, most of our stickers have changed status from “Implementation” phase to “Done” Phase!
Day Three
CoViMAS is getting to the final stage in the last day. The Room design is finished and the location of the images on the wall are determined. The tracker location is updated in the VR environment to represent the real location of the object. With this improvement the postcard can be touched while being viewed simultaneously.
Data
-
Fotografien aus dem Wallis von Charles Rieder https://opendata.swiss/dataset/photographs-of-valais-by-charles-rieder
-
Postkarten aus dem Wallis (1890-1950) https://opendata.swiss/dataset/postcards-from-valais-1890-1950
Team
-
Mahnaz Amiri Parian, PhD Student @ Databases and Information Systems Group
-
Silvan Heller, PhD Student @ Databases and Information Systems Group
-
Florian Spiess, MsC @ Computer Science Uni Basel
-
Fabian
-
Stef
-
Florence
Opera Forever
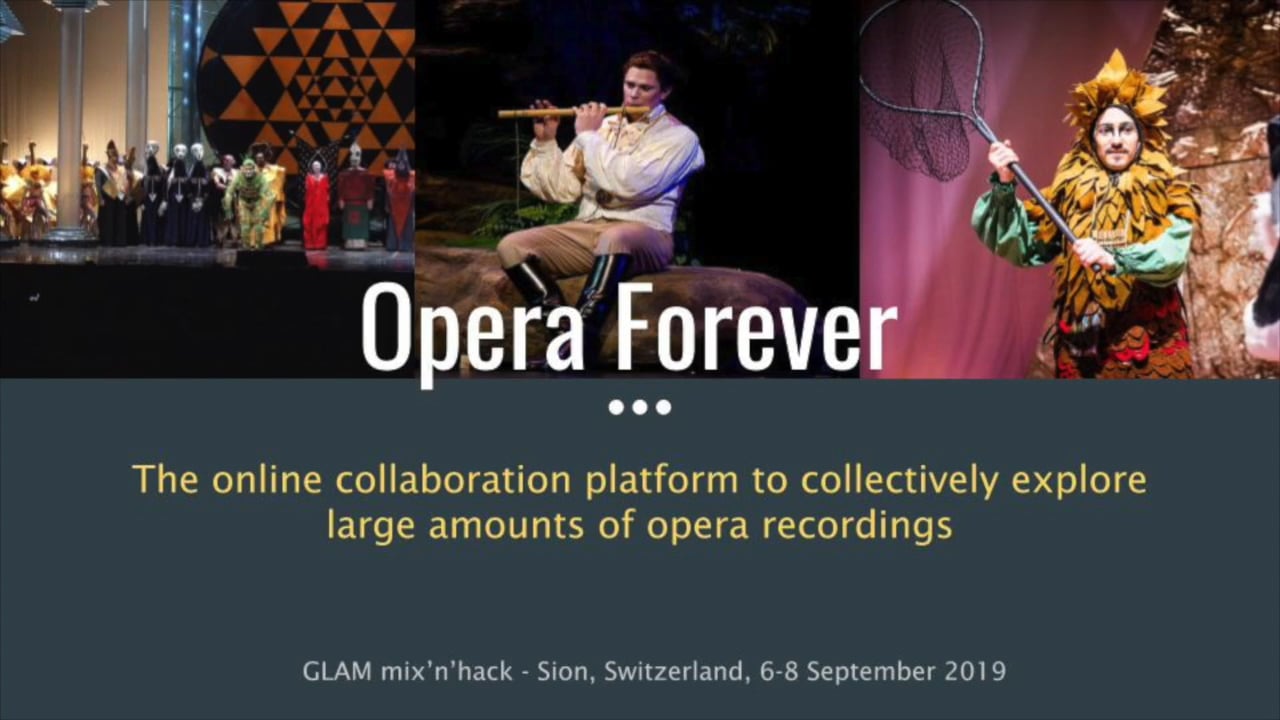
TimeGazer
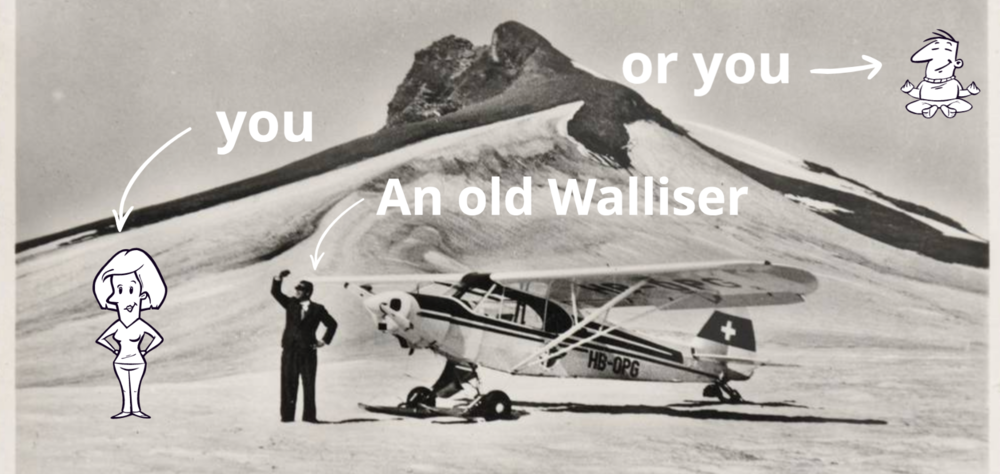
Welcome to TimeGazer: A time-traveling photo booth enabling you to send greetings from historical postcards.
Based on the wonderful “Postcards from Valais (1890 - 1950)” dataset, consisting of nearly 4000 historic postcards of Valais, we create a prototype for Mixed-Reality photo booth.
Choose a historic postcard as a background and a person will be style-transferred virtually onto the postcard.
Photobomb a historical postcard
A photo booth for time traveling
send greetings from the poster
virtually enter the historical postcard
Based on the wonderful “Postcards from Valais (1890 - 1950)” dataset,
consisting of nearly 4000 historic postcards of Valais, we create a prototype for Mixed-Reality photo booth.
One can choose a historic postcard as a background and a person will be style-transferred virtually onto the postcard.
Potentially with VR-trackerified things to add choosable objects virtually into the scene.
Technology
This project is roughly based on a project from last year, which resulted in an active research project at Databases and Information Systems group of the University of Basel: VIRTUE.
Hence, we use a similar setup:
-
HTC Vive Pro VR-Headset
Results
-
Website (password : Valais)
Project
Blue Screen
Printer box
Standard box on MakerCase:

Data
Quote from the data introduction page:
A collection of 3900 postcards from Valais. Some highlights are churches, cable cars, landscapes and traditional costumes.
Source: Musées cantonaux du Valais – Musée d’histoire
Team
-
Dr. Ivan Giangreco
-
Dr. Johann Roduit
-
Lionel Walter
-
Loris Sauter
-
Luca Palli
-
Ralph Gasser
«archives at» – Referencing Archival Fonds on Wikidata in a Semi-Automatic Way

Do You Know More? Crowdsourcing @ the Image Archive, ETH Library Zurich
Does AI Perform Better? – Metadata Enhancement through Deep Learning by Christian Stuber and Manuel Kocher, students at Bern University of
Connecting Coins Around the Globe - Numismatics and Linked Open Data
Aftermovie

A Film by Till Minder, Demian Spescha and Oliver Julier
Each year, the GLAMhack brings to life fascinating projects created by fascinating people! Before the hackathon, the participants usually don't know what to expect. After the hackathon, their minds are full of inspiration, new ideas and good memories (at least we hope so).
People who have never been to a hackathon often find it very difficult to imagine what actually "happens" during the event and that usually represents an obstacle for them to make the big step and participate for the first time. This challenge wants to solve this situation by providing a aftermovie of the hackathon's atmosphere, of the teams and their interactions, of the projects and the processes involved towards their realisation.
Challenge: Create an aftermovie of the GLAMhack20! The aftermovie should be fun to watch and give an idea of the hackathon's essence to people who have never been to a GLAMhack.
SwissAR

swissAR is a project based upon Toposwiss, a Virtual Reality model of Switzerland. swissAR is an Augmented Reality web app optimized for smartphones, allowing the user to get information about his surroundings (such as place names, peak and hilltop names, cultural heritage sites). Like Toposwiss, it is based on an open-data digital elevation model (DEM) published by the Swiss federal office of topography, as well as on toponymy databases listing Swiss city and village names, postcodes, mountain peaks, cultural heritage sites, bus and railway stations, sports facilities etc.
Instructions
 Launch your camera app, hold your smartphone upright and point it towards the QR code. Confirm website access, camera access, geolocation and motion sensor access. Hold still during calibration. As soon as swissAR displays the information you can turn around and discover any point of interest nearby.
In the center a compass will indicate your current heading by means of a compass needle and a degree indicator. The buttons at the bottom allow for adjusting the height of the virtual camera. Tap on the arrow-up button in order to lift the cam by 1000 meters or the arrow-down button to lower it respectively; on the bottom left a cam height indicator will display your current virtual height above ground level. Hit the reload button in order to recalibrate the app if needed.
Settings
To avoid the camera and locations confirm dialogs on startup you can adjust your smartphone settings.
- iOS Safari: Go to
Settings > Safari > Location Services > Allow
Settings > Safari > Camera > Allow - Android Chrome: Go to
Chrome > Settings > Location > Allowed
Chrome > Settings > Camera > Allowed
Technical
On startup swissAR will launch the camera, retrieve geolocation data, current compass heading and access motion sensor data. It will then process the elevation model in order to determine the user's height above sea level and any relevant point of interest within a given distance. swissAR will work anywhere in Switzerland; outside Switzerland it will take you to Berne (or any other place when using parameters, see below). swissAR does not store any kind of user or session data, neither on the device nor on the web server.
swissAR has been built by means of the Javascript framework A-Frame and the Augmented Reality component AR.js. A-Frame XR projects are rendered by any major web browser and on any platform. Yet, swissAR has been optimized for mobile use and will not work on desktop computers properly due to the lack of a rear camera or motion sensors.
Geography
In order to work properly, swissAR requires access to GPS by means of the HTML 5 geolocation API. The data output in the world geodetic format (decimal degrees) have to be converted into Swiss coordinates (zero point in Berne, see below). The Javascript processing is as follows:
navigator.geolocation.getCurrentPosition(function(position) { // HTML 5 geolocation API


   var n, e;


   var b1=position.coords.latitude∗3600; // conversion algorithm


   var l1=position.coords.longitude∗3600;


   var b2=(b1-169028.66)/10000;


   var l2=(l1-26782.5)/10000;


   n=200147.07+308807.95∗b2+3745.25∗Math.pow(l2,2)+76.63∗Math.pow(b2,2)+119.79∗Math.pow(b2,3)-194.56∗Math.pow(l2,2)∗b2;


   e=600072.37+211455.93∗l2-10938.51∗l2∗b2-0.36∗l2∗Math.pow(b2,2)-44.54∗Math.pow(l2,3);


}
The coordinates will then be rounded and matched against the DEM grid (further information on Wikipedia). Finally the scenery is aligned to the current compass heading which can be retrieved as follows (cross-platform solution):
window.addEventListener("deviceorientation", function(e) { // get current compass heading


   var heading;


   if (e.webkitCompassHeading) heading=e.webkitCompassHeading; // get webkit compass heading


   else heading=e.alpha; // get android compass heading


});
Parameters
swissAR is parametrizable in order to access locations other than the current one. Valid parameters are place names (case sensitive), postcodes or plain coordinates.
thomasweibel.ch/swissar(geolocation accepted) → current locationthomasweibel.ch/swissar(geolocation denied, or outside Switzerland) → zero point of the Swiss coordinate system (600 000 E/200 000 N) at the old observatory of the University of Bernethomasweibel.ch/swissar?ort=Chur→ Chur, Canton of Grisonsthomasweibel.ch/swissar?plz=8001→ Zurichthomasweibel.ch/swissar?lon=637071&lat=161752→ Wengen, Canton of Berne
Data
- opendata.swiss: Digital elevation model
- opendata.swiss: Place name and postcode database
- opendata.swiss: Toponymy database (further information by the Swiss federal office of topography)
Contact
Extra Moenia

Challenge: COVID19 is restricting and changing the way we can access buildings and we can experience space. For safety reasons, access to museums and cultural sites is strictly regulated and complex.
Vision: The outdoors represent a meaningful extension of museums and cultural sites. Connecting a building with the outdoors allows a different experience of the museum, its physical space and its collection.
Objective: Visualizing the ecosystem of connections of museums and cultural sites, by linking the building of the museum and cultural site to the outdoors. Combining data related to the collections to the original location of the objects, existing itineraries, potential venues, morphology of the territory, municipalities, mobility, infrastructure. Generating opportunities to create new itineraries (i.e. ethnographic, artistic, historical itineraries…) and new temporary exhibitions, dislocation of objects… We will focus on Ticino and on a series of examples.
Data available
Data we are currently uploading on openswiss.data
List of cultural operators in Ticino released by Osservatorio culturale del Cantone Ticino (DECS, Repubblica e Cantone Ticino) https://it.wikipedia.org/wiki/Wikipedia:Raduni/Prova_il_tasto_modifica/Elenco
Data on Val Piora released by the Cantonal Museum of Natural History of Lugano (rocks, flora, fauna, landscape, water)
Data on the Verzasca Valley released by the Museum of Val Verzasca (ethnographic itineraries, past exhibitions, museum collection)
Data on Leventina released Museum of Leventina (museum collection, past exhibitions)
Data on Neuralrope#1, permanent interactive installation at the pedestrian tunnel of Besso, Lugano, released by the municipality of Lugano (interaction of the public and daily passages).
We have already uploaded in 2018
On OpenStreetMap the repository made by the Osservatorio culturale del Cantone Ticino enriched with locations suggested by citizens
On Wikidata a selection of cultural institutions part of the repository made by Osservatorio culturale del Cantone Ticino
1914 - Newspapers at War

1914 was an interesting year not only because of the beginning of the First World War. The first cars clattered along unpaved dust roads, the first telephone lines crackled, trams drove through rapidly growing cities: Switzerland from the beginning of 1914 was dynamic and ambitious. But the war brought fear and uncertainty to the neutral country.
In our project we take a look at Switzerland in 1914, when Switzerland had 3.8 million inhabitants and life expectancy was around 54 years.
In addition, a rift between German- and French-speaking Swiss also developed during this period. After Germany's invasion of Belgium, many Belgians fled to France, from where they wanted to reach French-speaking Switzerland. Swiss who wanted to take in such refugees were asked to register with a private organization in Lausanne. Within a few weeks, hundreds of applications were received there.
This hospitality caused frowning in German-speaking Switzerland.
This was the beginning of a rift called the "Röstigraben" which still runs along the language border today.
On Opendata.swiss we found the data of two French-speaking Swiss newspapers from 1914. The data include articles of the year 1914 of the newspapers "Gazette de Lausanne" and "Tribune de Genève".
Our plan was to translate as many articles as possible into German using the Google Cloud Translation or the DeepL API. After some conception-work we decided not to use these APIs because we didn't need them. We wanted to focus only on a few articles of special events which can be translated manually. We thought it would be better only to publish relevant
The translated articles are being published on a website and are being enriched with similar articles from nowadays.
Link to the data: https://opendata.swiss/en/dataset/journal-de-geneve-gazette-de-lausanne-1914
Link to the prototype: https://glamhack2020.sandroanderes.ch/
Match with the Mountains

In our project want to focus on the beauty of nature, that‘s why we decided to use the dataset «The Call of the Mountains».
Our aim is to generate an interactive map, which allows the user to quickly get an overview of the mountains around «Graubünden».
Frontpage (Map of Mountains)
-The map consists of several districts. After selecting one area, the user is able to see different suggestions - inside the selected district.
Subpage1 (Variety of Cards)
-After clicking the "See More"-button the user is directed to the first subpage.
-There will be shown a variety of different mountains - located in the chosen district and displayed as cards.
Subpage2 (Personal Choice)
-Once the user made his choice, he can get more details by using the "See Profile"-button.
-This leads to a second subsite, where the image of the selected mountain-card appears in full size
-Also more information about the background and location are visible.
Contact: Mirjam Rodehacke & Nicole Nett (students at FHGR)
Data Source: Fundaziun Capauliana
GLAM Inventory
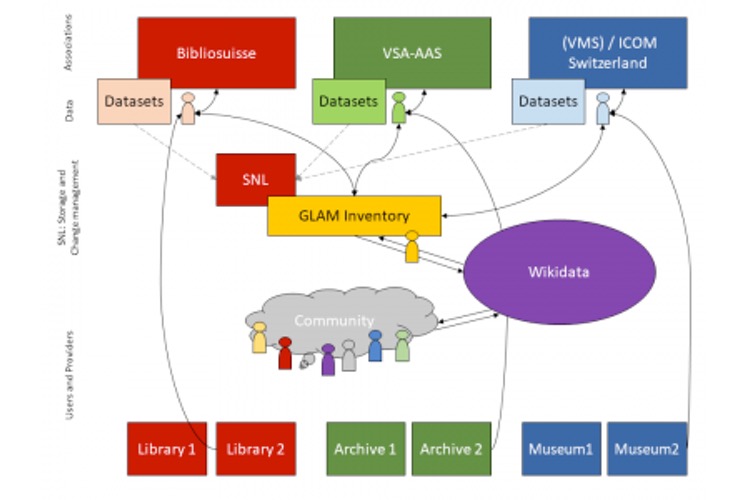
Switzerland has a great ammount of libraries, archives and museums, but we are still missing a common directory of all these heritage institutions.
Challenge: The goal is to create a complete inventory of Swiss libraries, archives and museums and to find a solution for the data maintenance of this directory.
Vision: The "ideal" directory of Swiss GLAMs is up-to-date, complete, user-friendly, internationally compatible and structured. The contents are indexed and categorized, accessible to people and machine readable. Information about the collections and opening hours are included and a differentiated accessibility is ensured.
Scope: The directory could be used for the compilation of statistics, for research on collection holdings, institutions and/or events (research, reference works, tourism).
Culture in Time

Simple event calendar for public viewing that written in Rails, SParQl and Semantic UI (web interface platform). Using existing linked open data (LOD) on productions & events, locations & venues, and dates to feed contemporary and historical data into this calendar. Coming soon: LOD on artists and works.
Find information on this project in Glamhack Wiki and here.
Go to https://culture-intime.herokuapp.com/ and view calendar
Data Sources
Building on dataset already integrated into Wikidata: data from Schauspielehaus, Zurich. For reference see: https://www.wikidata.org/wiki/Wikidata:WikiProject_Performing_arts/Repor... Using data from Artsdata.ca: pan-Canadian knowledge graph for the performing arts
Background
The intention of this project was to two-fold: -Provide a robust listing of arts and cultural events, both historical and current. Audiences are able to search for things they are interested in, learn more about performing arts productions and events, find new interests, et cetera. - Reduce duplication of work in area of data entry
The code is a simple as possible to demonstrate the potential of using LOD (structured data) to create a calendar for arts and cultural events that is generated from data in Wikidata and the Artsdata.ca knowledge graph.
The user interface is designed to allow visitors to search for events. They can: - Use the Spotlight feature to quickly view events based on the following search criteria: name of city and predetermined date range. - Use Time Period buttons to search a time period (international). - Use a Search field to enter a search using the following criteria: name of production, city and country. - Select an image from a gallery to find related information.
Note: Currently when you enter a location, data only exists for Switzerland and Canada (country), Zurich or Montreal/Laval (city)
Search results list events sorted by date, title and location.
Challenges: Data is modelled differently in Wikidata, Artsdata, and even between projects within the same database. Data has very few images.
Interactive Storytelling Across Generations
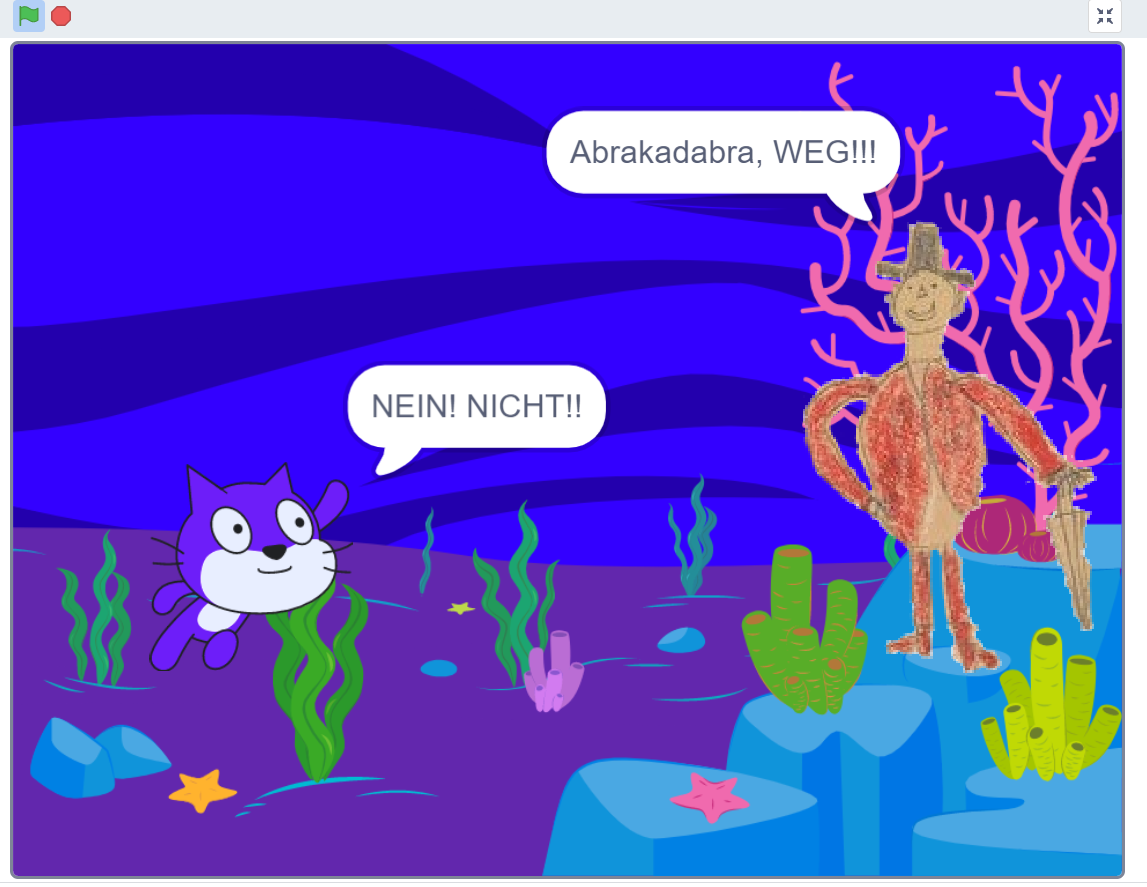
Developing digital learning in creative subjects by using paintings of childrens drawings or part of it of the collection Pestalozzianum.
We started with the question: How can we interact more with the people and maybe enrich the childrens drawings of the Pestalozzianum with more information?
3 cases are developed to make the web space of the collection more vivid, encourage children to interact and activate their fantasy.
Main challenge: How to learn effectively? (by the spirit of Pestalozzi)
Contact: Sylvia Petrovic-Majer (sylviainpublic@gmail.com)
Swiss Name Chart

As we work for two days on this challenge, we've decided to determine, thanks to an open data set, the five most popular family names for the female and male population in 26 cities, in 26 cantons, in Switzerland.
We want to visualize this data on an interactive map which shows what family names are predominantly represented throughout the country.
We want to visualize this data on an interactive map which shows what family names are predominantly represented throughout the country.
An example is to find here: https://codepen.io/aomyers/pen/LWOwpR
We have not looked at the data set closely enough . it is always only the top 5 surnames per postal code. Sorted by woman and man. So we couldn't just say: These are the top 5 surnames per canton, because we would falsify the evaluation.
So we decided to simply choose one postcode per canton and selected the data in Google docs and then converted it into a Jason.
The goal is to create a One pager where you can see one city per canton, which is divided into top 5 men's last names and top 5 women's last names.
The dataset we used: https://opendata.swiss/de/dataset/nachnamen-pro-plz
First steps:
1. Some big cities in Switzerland are not mentioned. That means that the swiss post didn’t collect names there.
1. Some rangs are doubled because of the same number of names on the ranglist. Example: in Kloten are 35 surenames Mueller and 35 surenames Jäger -> so they show both as rang 5.
For our project we only can use one name. Jäger and not Mueller for example.
-
We made our own list. We had to find out wich is the next big city in the canton.
Check if there are double rangs and delete it if needed. -
After that, we converted the excel list to a json object. That json-list is now input of our javascript-file.
Next steps and problems:
4. We recognized, that we need should use a databank. This is unfortunately way out of our programm skillz and would take to much time.
5. RETHINK: How can we still manage that the lists appears?
6. SOLUTION, (thank you brain), -> its possible to show the list female and male on each side, with flexboxes. For that we need to make excel lists for each canton.
We’ve been working with atom and the integrated teleport package in order to be able to work together.. However, the team member who’s the owner of the files must always be online and always active, or else the invitees cannot access the files.
To be more precise: First of all, typed in a connection from the list in HTML to the pictures. They're changinge everytime they got hovered/unhovered. In a next step, we had to implement the .json, what wasn't easy because we didn't use a database so far in the reason of the time range. So we had to create a function, where the locations have to pass through our .json file. forEach() we used also to gather the gender and similar data out of JSON. Right after, we had to create a function for the table title. We had to create a function to read and parse the JSON:
function loadJSON(callback) {
var xobj = new XMLHttpRequest();
xobj.overrideMimeType("application/json");
xobj.open('GET', 'convertcsv.json', true);
xobj.onreadystatechange = function() {
console.log(xobj.readyState);
if (xobj.readyState == 4 && xobj.status == "200") {
// Required use of an anonymous callback as .open will NOT return a value but simply returns undefined in asynchronous mode
callback(xobj.responseText);
}
};
xobj.send(null);
}
This was the most important step to set it up without a database.
LEARNINGS:
We got the hint, that it's also possible to work on Github together and we'll definitely going to do that by the next project.
The programming was kept very easy, as we are only Newbies.
We made a map with pictures, every canton was one. For the hover we made an overlayer to color the canton red.
We connected it with a class to the right name button.
Art exhibitions, 1945-2020
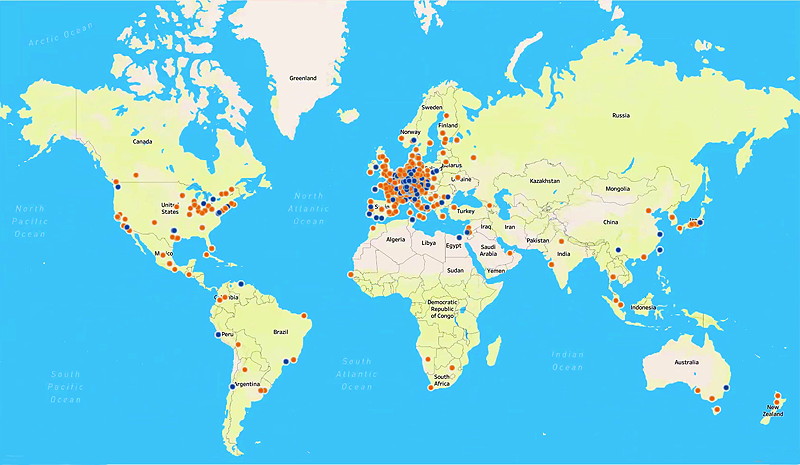
Pitch
This project aims to create a friendly user interface to visualize and interact with a dataset of 50'000 exhibitions from SIKART.ch on a world map.
Description
This is a project realized by Ishan Mishra, using a dataset from the Swiss Institute for Art Research (SIK-ISEA) which contains about 50'000 art exhibitions from SIKART.ch, the online lexicon of SIK-ISEA documenting the activities of artists related to Switzerland, either through nationality or through sustained artistic activity in Switzerland.
Dataset
The dataset lists each of the 50'000 exhibitions title, start and end date, name of hosting institution, names of participating artists who are documented in SIKART, latitude and longitude data for the exhibition location and link to the respective exhibition entry in SIKART. The dataset is openly available in CSV format here:
https://drive.google.com/file/d/1dfqCHxai16hnkAXC_UCiU3b3J9EUHrTQ/view?usp=sharing
First draft
A first draft focused on visualizing the density of exhibition activity per year:
https://public.tableau.com/profile/ishan.mishra8696#!/vizhome/Artexhibitionsannually/ArtExhibtionsAnnually?publish=yes
Final version
The final result of the hackathon displays the exhibitions on a map and allows the user to filter exhibitions by start and end dates, by artist, and by type of exhibition. It also lists the amount of exhibitions per artist for the filtered result on a chart next to the map:
https://public.tableau.com/profile/ishan.mishra8696#!/vizhome/ArtExhibition1945-2020/ArtistDashboard?publish=yes
Note on final version and further development
Projects shown through the web version of Tableau Public respond quite slowly to user input like filter changes. The Tableau Public workbook can be downloaded at the above link and opened locally which makes the map much more responsive and also allows for changes to the workbook. Tableau Public was chosen as a freely available software to also allow for further work on the project by those who are interested. The dataset from the link above is also free to be used.
Technologies
Tableau Public, Open Refine, CSV
Contact
Ishan Mishra: ishanmisra200@gmail.com or https://github.com/SnickeyX
Detect Looted Art
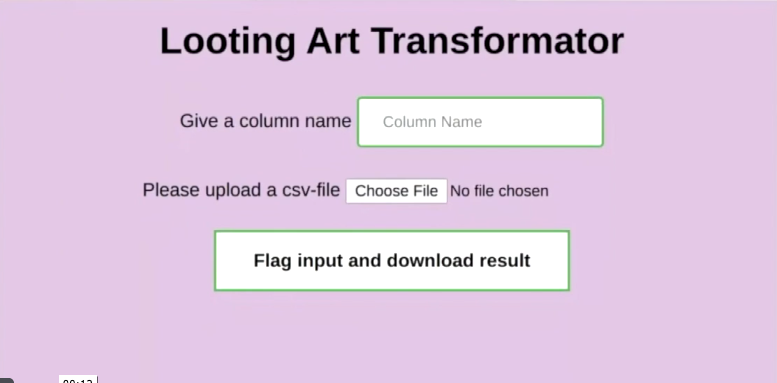
The Question: How to sift through the millions of objects in museums to identify top priorities for intensive research by humans?
The Goal: Automatically Classify and Rank 70,000 art provenance texts by probability that further research will turn up a deliberately concealed history of looting, forced sale, theft or forgery.
The Challenge: Analyse texts quickly for Red Flags, quantify, detect patterns, classify, rank, and learn. Whatever it takes to produce a reliable list of top suspects
For this challenge several datasets will be provided.
1) DATASET:70,000 art provenance texts for analysis
2) DATASET: 1000 Red Flag Names
3) DATESET: 10 Key Words or Phrases
TRIAGE: You're the doctor and the texts are your patients! Who's in good health and who's sick? How sick? With what disease? What kind of tests and measurements can we perform on the texts to help us to reach a diagnosis? What kind of markers for should we look for? How to look for them?
Europa meets Europe

Description: In this art project, random images of the Galilean Moon Europe from the NASA archive are overlaid pixel by pixel with current images from European webcams in rhythm with the Jupiter Symphony by Mozart. The art project links and connects the continent of Europe with the 1610 by Galileo Galilei discovered Jupiter moon, which is around 660 million kilometers away. Each time the application is started it loads a new webcam image from Berlin, Rome, Paris, Oslo, Zürich or Chur and a new image from Europa. There is never the same combination.
Data: The dynamic images of Europe are accessed via the NASA API, the webcams via the Windy API. In the current version the music from Wikimedia Commons is directly loaded from the web server.
Technology: HTML, Javascript, P5.js and PHP
Current version: The current version achieves the goals set at the beginning of the GLAM hack 2020.
Future improvements: depending on the two dynamically loaded pictures the sizes are not equal. They have to be resized.
Main difficulty: At the beginning the error access to fetch at ... from origin ... has been blocked by CORS policy appeared when loading the NASA pictures with Javascript. The solution was to save to pictures dynamically to the web server with Javascript.
Contact: Martin Vollenweider
Georeferencing and linking digitized archival Documents
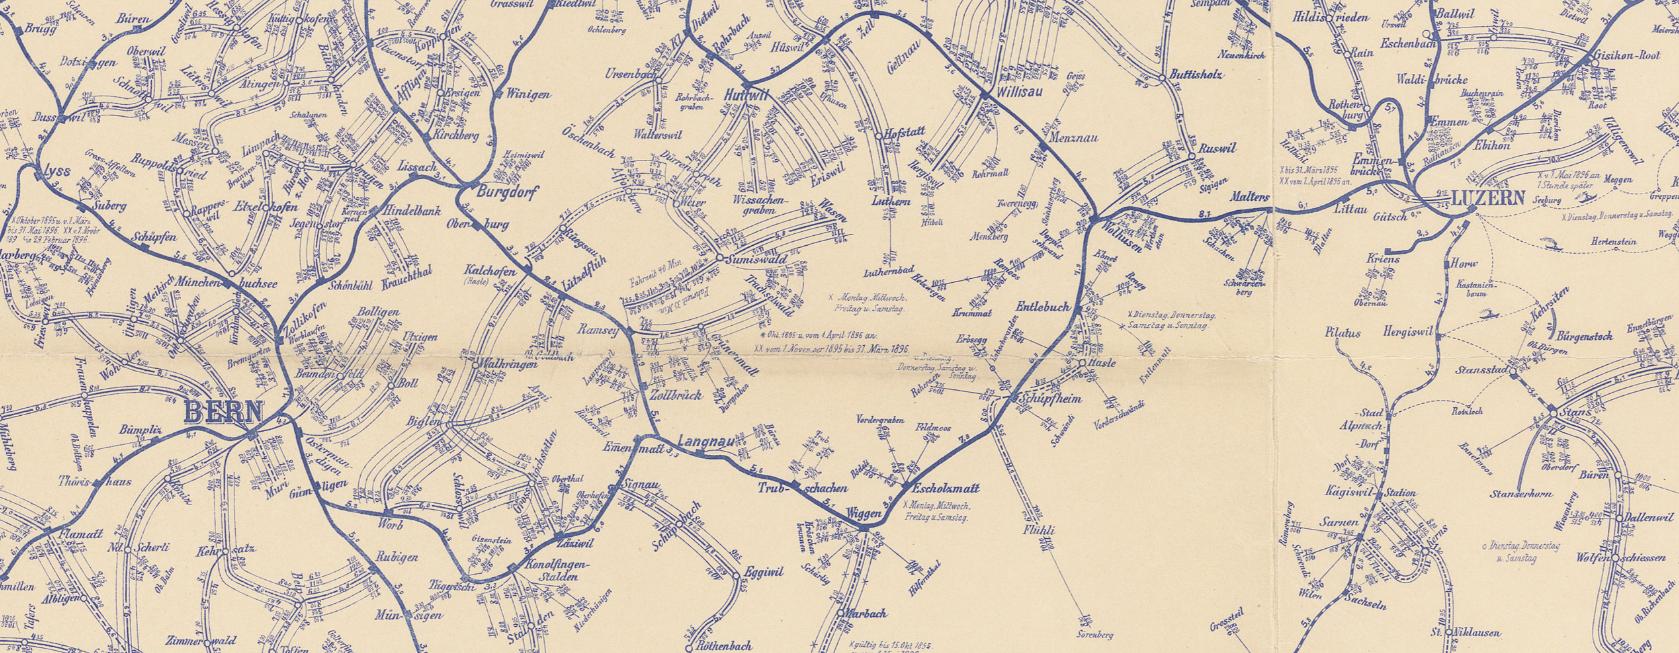
The PTT archive is increasingly digitising its collections with the aim of not only making documents more easily available, but also of making them accessible, linked and analysed in new ways. Many of these Documents can be assigned to one or more geographical points. Three such records are presented below, with the idea of trying out new approaches and concepts:
Poststellenchroniken: This OpenRefine dataset contains an extract of the archive database with metadata on the post office chronicles stored in the PTT archive. The post office chronicles contain collected information, partly also newspaper clippings, photos and plans of all historical post offices of the PTT. The archive database entries for each dossier were prepared in OpenRefine, assigned to a post office (there are sometimes several dossiers per post office) and then linked to the corresponding current administrative communities on Wikidata via OpenRefine's Reconciliation Service. This linkage is currently not yet fully completed. The aim is firstly to record entries for the post offices on Wikidata itself, and secondly to enable a rough geo-referencing of the post offices via the link to the municipalities, which would otherwise only be possible via a time-consuming, manual re-listing.
Postkurskarten: The dataset contains a selection of retro-digitized "Postkurskarten" of the Swiss PTT between 1851 and 1941, providing information on postal connections and the respective departure and arrival times. The older maps depict the entire network of postal connections (stage coaches and later also railway and post bus services), while the more recent maps are somewhat more schematic. The selection presented here gives an impression of the maps archived in the PTT archive. However, there is a large number of other maps (also on telecommunications) with a different geographical focus and covering the entire period of existence of the PTT. The file names correspond to the archive signature of the course charts.
The "Postkurskarten" are to be digitally annotated. Where possible, this should be done automatically (e.g. via text recognition) or via easy to use public collaborative tools. Maps prepared in this way could then be used for assigning/linking other archive documents on them geographically.
Postauto Postkarten: The data set contains a selection of retro-digitized postbus postcards from the PTT archive. These postcards each show Postbuses on known routes, especially pass lines. They were produced by the PTT for advertising purposes. Also here, possible methods for georeferencing shall be experimented with. These references can then be linked and localized with the annotated maps.
Graubünden Mountain Hunt

MountainHunt is about providing geodata on old images. From a collection of 179 Pictures, that were taken between 1800 and 2000, you can choose one and try to find its origin. Them recreate it as good as you can and upload the new Version. On that way, we collect Geo-Data on the old Pictures. We crate a time-machine for everyone to join and experience.
Sir Dridbot Glamhacker
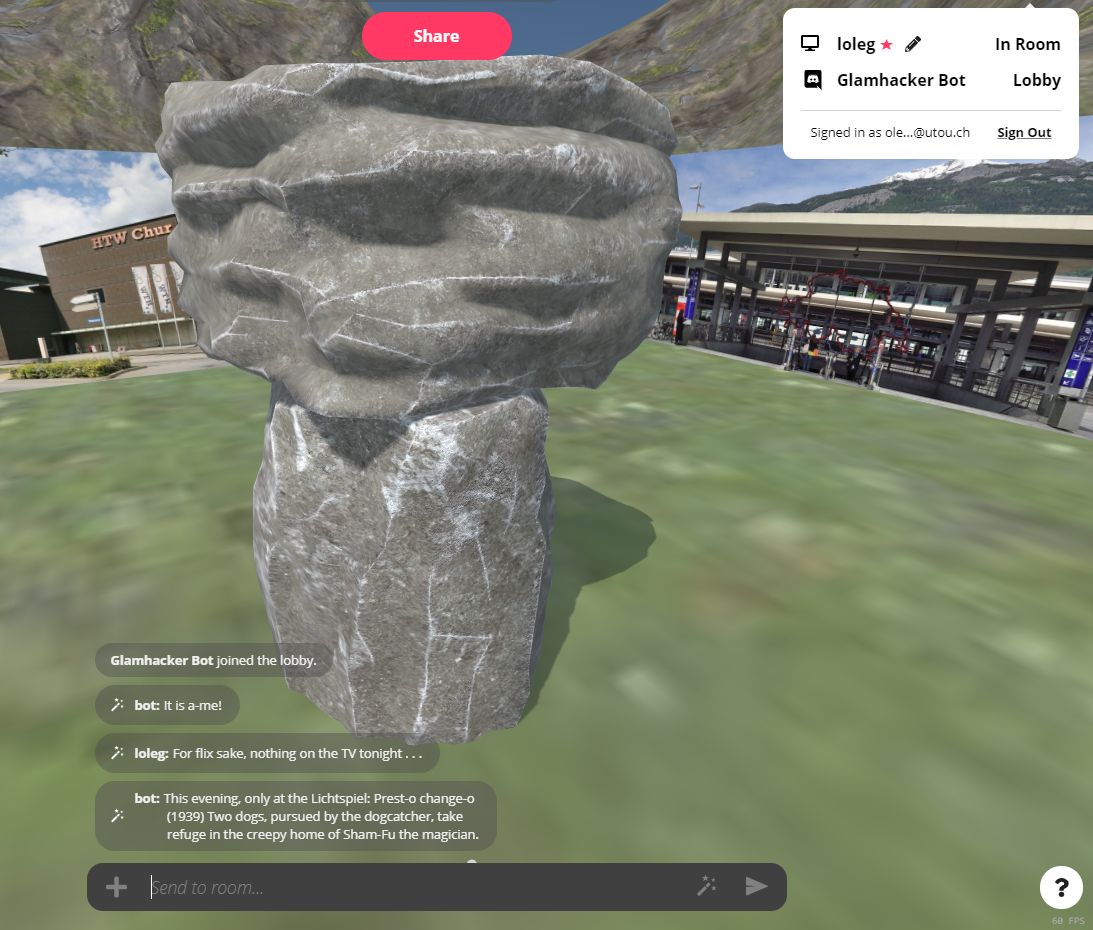
We worked on ideas for enabling access to archive data using chatbots, which you can interact with right inside of the official chat platform of #GLAMhack2020. Details and screenshots are in the notebook.
The Pellaton Experience
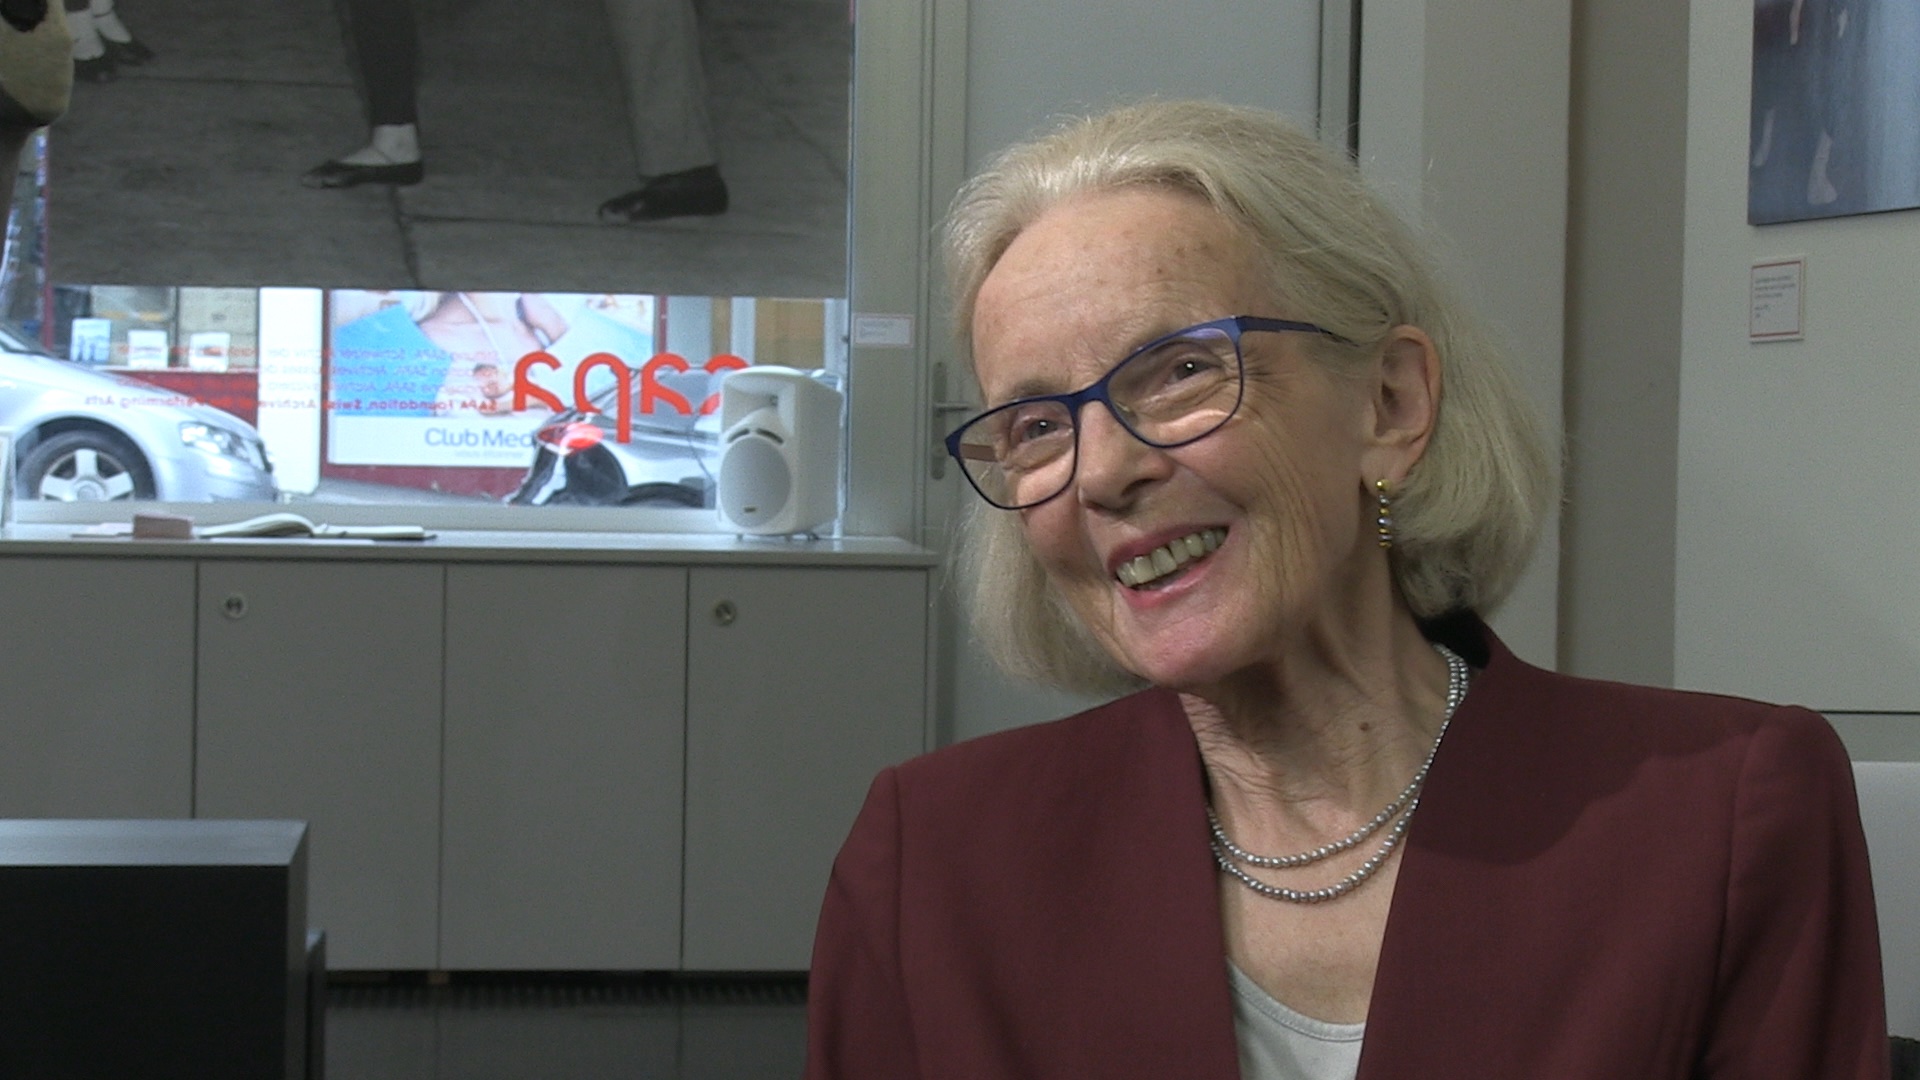
Ursula Pellaton (*1946) is a walking encyclopedia of Swiss dance history. Her enthusiasm for dance began in 1963 with a performance of "Giselle" in Zurich. That was the beginning of her many years of involvement with dance, which has accompanied her ever since as a journalist and historian, among other things.
She shared a lot of her knowledge in 16 hours of video recordings that were the basis for a biography in traditional book form. However, both video and book are limited by their linear narratives that differ from our experience of history as a living network of people, places, events, and works of art. Based on a longer excerpt from the recordings and its transcript, we would like to turn this oral history document into a comprehensive online experience by creating a navigable interface and augmenting the video with supplementary information and material.
1971 and all that - Women’s Right to Vote in Switzerland

By Heinz Baumann, Comet Photo AG (Zürich) - This image is from the collection of the ETH-Bibliothek and has been published on Wikimedia Commons as part of a cooperation with Wikimedia CH. Corrections and additional information are welcome., CC BY-SA 4.0, https://commons.wikimedia.org/w/index.php?curid=99507189
2021 marks the 50th anniversary of women’s suffrage in Switzerland: a perfect opportunity to investigate what led to the events in 1971 and what happened since then.
In our challenge, we focused on the discourse around women, feminism and women’s right to vote in Switzerland by analysing relevant newspaper articles. Our aim was to apply natural language processing methods on those texts that are accessible via the impresso app. This app - product of an SNF funded project - contains a huge number of digitised articles that were published between 1740 and 2000. It mainly features historical newspaper collections, but also the archives of Le Temps and the Neue Zürcher Zeitung. Some of the articles from the Impresso corpus are subject to copyright, therefore we cannot share them publicly.
In this corpus we wanted to identify characteristic topics that are related to women’s suffrage in Switzerland. We created a topic model and an interactive wordcloud in a Jupyter notebook. A first topic model which still has to be improved has been visualised. Further steps would be to visualize how the identified topics in the articles referring to the women's suffrage evolved over time, e.g. by a timeline slider.
Project Page
A walk trough Zurich around 1910
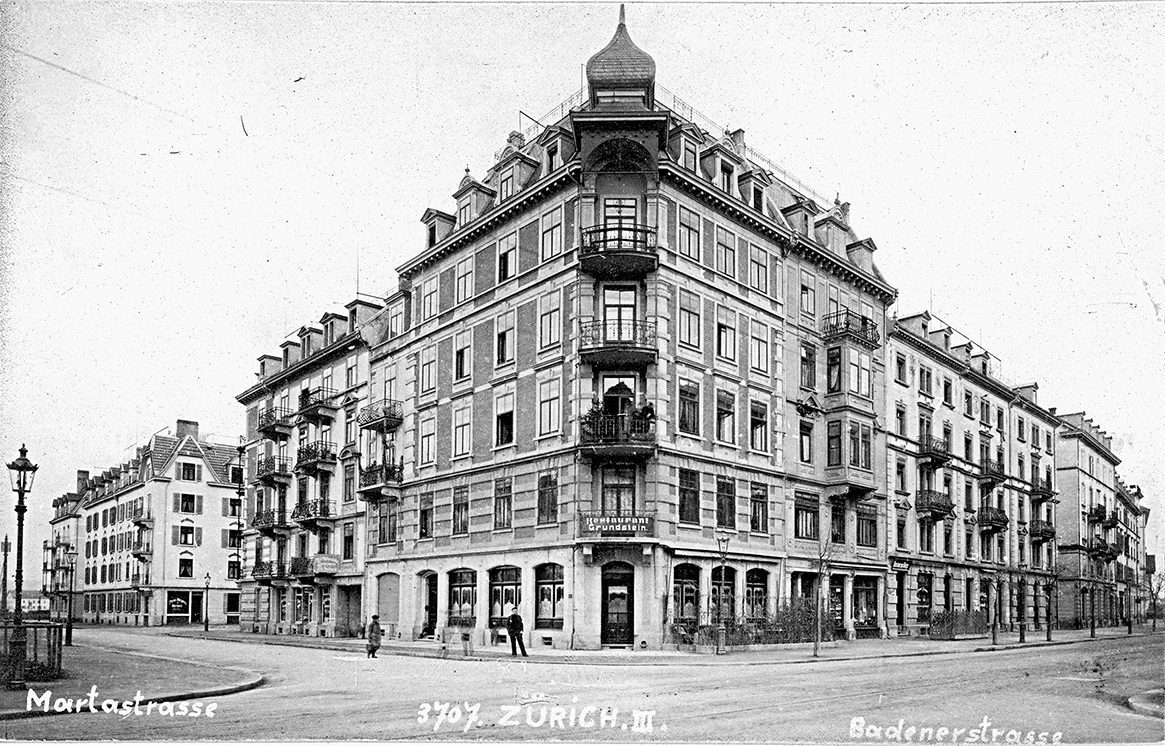
https://baz.e-pics.ethz.ch/latelogin.jspx?recordsWithCatalogName=BAZ:187925
Following the paths of Friedrich Ruef-Hirt discovering his fascinating photographs taken between 1905 and 1910.
A new data set contains images by the photographer Friedrich Ruef-Hirt (1873-1927). Between about 1905 and 1910, he systematically documented all the neighbourhoods of the new greater Zurich area after the town's expansion in 1893. In just a few years, he created a unique collection of pictures of houses and streets. The pictures were originally available as postcards.
The city's Archives of Architectural History (Baugeschichtliches Archiv der Stadt Zürich) contain more than 1000 postcards by Friedrich Ruef-Hirt. They offer a unique opportunity to reconstruct the city around 1910. Since the artist numbered his works on the front side it might be possible to re-live his photographic walks through town on an contemporary map or in the new 3D street model published by the city of Zurich.
Dataset: https://data.stadt-zuerich.ch/dataset/baz_zuerich_um_1910
Browse the pictures: http://baz.e-pics.ethz.ch/index.jspx?category=801
Map of Zurich 1913: http://baz.e-pics.ethz.ch/index.jspx?category=26197 (also available already georeferenced)
3D-Model of Zurich: https://www.stadt-zuerich.ch/ted/de/index/geoz/geodaten_u_plaene/3d_stad...
Some more historical Background
The City of Zurich contained of no more than 12'000 Buildings around the year 1910 (compared to almost 55'000 today). In one thousand of the houses in 1910 there was some kind of bar or restaurant (a.k.a. 'Bierhalle' or 'Trinkstube') included, which means in almost every 10th building! Lots of these establishments were located in the corner house of a block and lots of them can be seen and identified in Ruef-Hirts photographs. Names and locations of the restaurants can be found in the old adress books of the city (a very useful source for historical Research by any means), see: https://drive.google.com/drive/folders/12cnmRlf_PUZ1Jb9aWpKqHwi-tuVRIWUg... (unfortunately not fully online digital yet).
Contact: Saro Pepe Fischer, Baugeschichtliches Archiv der Stadt Zürich, Neumarkt 4, 8001 Zürich | saro.pepefischer@zuerich.ch
Collection Chatbot: Silverfish

Interactive chatbot which guides you through the collection and recommends object based on user-input. Narration driven experience of the collection.
What we achieved
Prototype running on telegram
Data: Dataset SKKG small selection of objects of famous people two stories:
Sisi
historical drinking habits
Show images
Show links (eg. wikipedia)
ToDo / long term vision
automation (generate text from keywords)
Gamification
Memory: Ask people to select similar objects and compete against each other
Questions: Allow people to guess the right answer
different backend? website integration
easy UI to manage stories etc.
integration into collection database (Museum Plus RIA)
more stories
mix automated content with curated content (e.g. if there are new objects in the collection to tell a story)
Try prototype: https://t.me/SilverFishGlamBot
(if you get stuck: "/start" to restart)
For documentation see: GitHub
Contact: Lea Peterer (l.peterer@skkg.ch)
Team: Lea, Micha, Yaw, Randal, Dominic
e-rara: Recognizing mathematical Formulas and Tables

The ETH Library enables access to a large number of scientific titles on e-rara.ch, which are provided with OCR. However, these old prints often also contain mathematical formulas and tables. Such content is largely lost during OCR processing, and often only individual numbers or letters are recognized. Special characters, systems of equations and tabular arrangements are typically missing in the full text.
Title
The aim of this project is to develop a procedure for selected content, how this information could be restored.
Data
Images & Full texts from e-rara.ch
OAI: https://www.e-rara.ch/oai/?verb=Identify
Contact
Team Rare Books and Maps ETH Library
Melanie, Oliver, Sidney, Roman
ruk@library.ethz.ch
helvetiX: An XR guide to Helvetia

Tabula Peutingeriana, 1-4th century CE. Facsimile edition by Konrad Miller, 1887/1888
4th century Romans travelling to foreign countries had accurate road maps of the Roman Empire. One of those Roman road maps has been preserved and today is known as "Tabula Peutingeriana" (Latin for "The Peutinger Map", from one of its former owners, Konrad Peutinger, a 16th-century German humanist and antiquarian in Augsburg). The map resembles modern bus or subway maps and shows all major settlements and the distances between them, a feature which makes it a predecessor of modern navigation systems.
The Peutinger Map is an illustrated itinerarium (ancient Roman road map) showing the layout of the cursus publicus, the road network of the Roman Empire. The map is a 13th-century parchment copy of a (possible) Roman original and is now conserved at the Austrian National Library in Vienna. It covers Europe (without the Iberian Peninsula and the British Isles), North Africa, and parts of Asia, including the Middle East, Persia, and India.
heARTful – Art & Emotions

Brief project description:
Everybody experiences emotions. This is the starting point for a journey of discovery through art, on which we would like to take as wide an audience as possible.
A web app shows artworks and asks users which emotion(s) they trigger in them. The six universal basic emotions of fear, joy, anger, sadness, disgust and surprise are suggested. There is also the possibility of describing one's own feelings in a differentiated way in a free text field.
After clicking on one emotion tag, you can see how other users feel about this artwork.
An info button can be used to display the «reverse side» of the picture, which contains precise information about the artwork (artist, title, date, technique, dimensions, copyright, picture credits).
Arrow navigation takes you to the next work of art, which can be responded to emotionally.
Technical description:
The project team worked with image and metadata from the photo archives of the Swiss Institute of Art Research SIK-ISEA. Link to the data sets:
https://opendata.swiss/de/dataset/kunstwerke-aus-dem-bildarchiv-von-sik-...
https://opendata.swiss/de/dataset/werkverzeichnis-der-kunstlerin-eva-aep...
A node.js server and a react-frontend are used. The webapp runs in the browser and is therefore accessible under a URL.As an admin, any selection of images can be loaded into the app and made available to a specific audience.
Possible contexts of application: Art education, museum, school, art therapy
Project team: Anna Flurina Kälin, art educator und information scientist; Jan Lässig, digital art educator and multimedia producer; Thomas Stettler, information scientist; Angelica Tschachtli, art historian
Link to project presentation: https://museion.schule/vermittlung/heARTful-presentation.pdf
St. Galler Globus

Among the many treasures of the Zentralbibliothek Zürich the St. Galler Globus offers a controversial history, interdisciplinary research approaches and narrative richness. The globe is a magnificent manifestation of the world concept of the late 16th century. The modern (for its time) cartographical knowledge, representation of current (i.e. contemporary) and historical events and diverse mirabilia combined with its overwhelming size and opulent paint job certainly led it to be a “conversational piece” wherever it was exhibited.
Even though it is a fully functional earth and celestial globe regarding its size and elaborative decorative artistry, it is assumed that the globe was more of a prestigious showpiece than a scientific instrument. The globe's full splendor is best appreciated by exploring the original at the Landesmuseum Zürich or its replica in the Stiftsbibliothek St. Gallen. Because of its size and fragility it is not possible to make the globe fully accessible for exploration to the public.
That is where you can step in! Fortunately the ETH Institute of Geodesy and Photogrammetry made a high resolution 3D prototype available for both the original and the replica globe (Low Resolution Preview: https://hbzwwws04.uzh.ch/occusense/sg_globus.php).
Combined with the rich expertise around the St. Galler Globus we want to create digital concepts of how we could make the St. Galler Globus’ narratives and historical context accessible to a broader audience interested in “Scientainment”. We are looking for people who want to create digital prototypes, write and visualize narratives, conceptualize interactive experiences or find other ways to show the rich narratives of the St. Galler Globus.
With those concepts we want to show the potential inherent in exhibiting a digital version of the St. Galler Globus.
Passwords to the sources: Magnetberg
Mapping A Collection
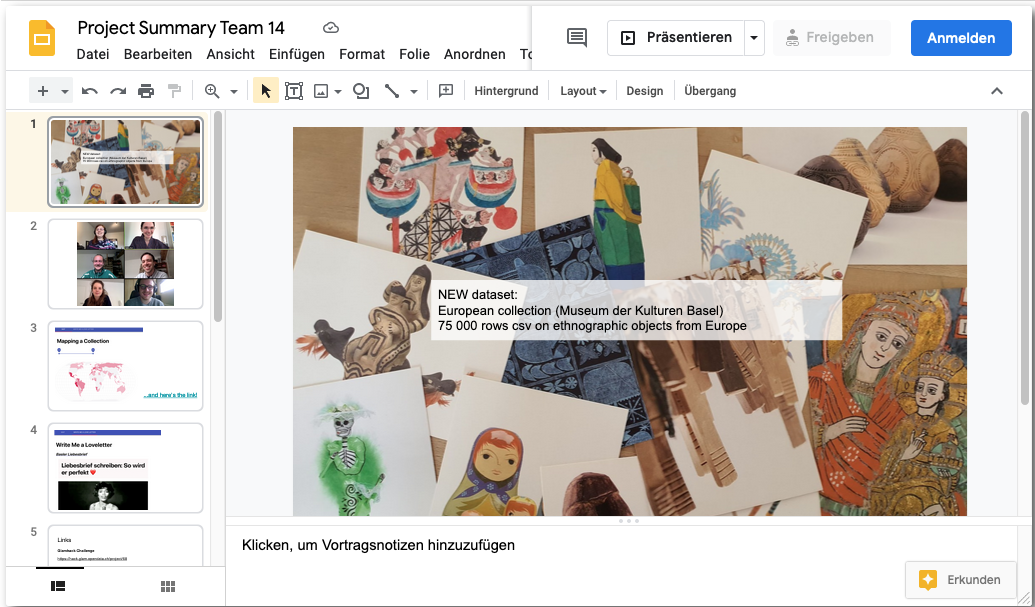
How did geopolitics and scientific interests affect provenances in a collection of 75 000 European artefacts?
The Museum der Kulturen Basel (MKB) is the largest ethnographic museum in Switzerland and one of the most eminent of its kind in Europe. The MKB collections are renowned throughout the world; in total they hold over 340 000 artefacts from all over the world. A large number of them stems from various places in Europe – from northern Scandinavia to the South of Greece, from Portugal to the Carpathians, from remote Alps to bustling cities. This European collection comprises around 75 000 artefacts, such as religious objects, handicraft, cloths, pictures, toys and everyday items. They came into the museum’s collection as acquisitions or gifts during the last 120 years.
While in the very beginning the focus of the collectors was on objects from remote Swiss hamlets, the interest slowly shifted to artefacts from industrialised environments. Changing geopolitical developments enabled collecting in different regions of Europa at different times. Also, personal interests or personal connections of single collectors led to sudden large additions from one specific area.
The goal of this challenge is to show the rise and fall of dominant geographical provenances during the last 120 years of collecting in Europe. This could enable the answer to interesting questions such as: Which specific spatial interests arose and fell during the last 120 years? How did the idea of Europe’s border change over time? When was the peak of collecting in remote Swiss valleys? Which were the effects of the First and the Second World War on the geographical provenance of new acquisition? How did the fall of the Iron Curtain affect the collection practice?
The data provided by MKB has never been published before. It stems from a database used for managing the collection, which grew over generations. There are inconsistencies on different levels, as errors and omissions occurred both when the objects were first cataloged and when the catalogues were transcribed into the database. Terminologies contained therein may today be inaccurate, outdated, or offensive. The provided material may be raw – but to the same extent its quantity and uniqueness is precious!
Wikidata Tutorial Factory
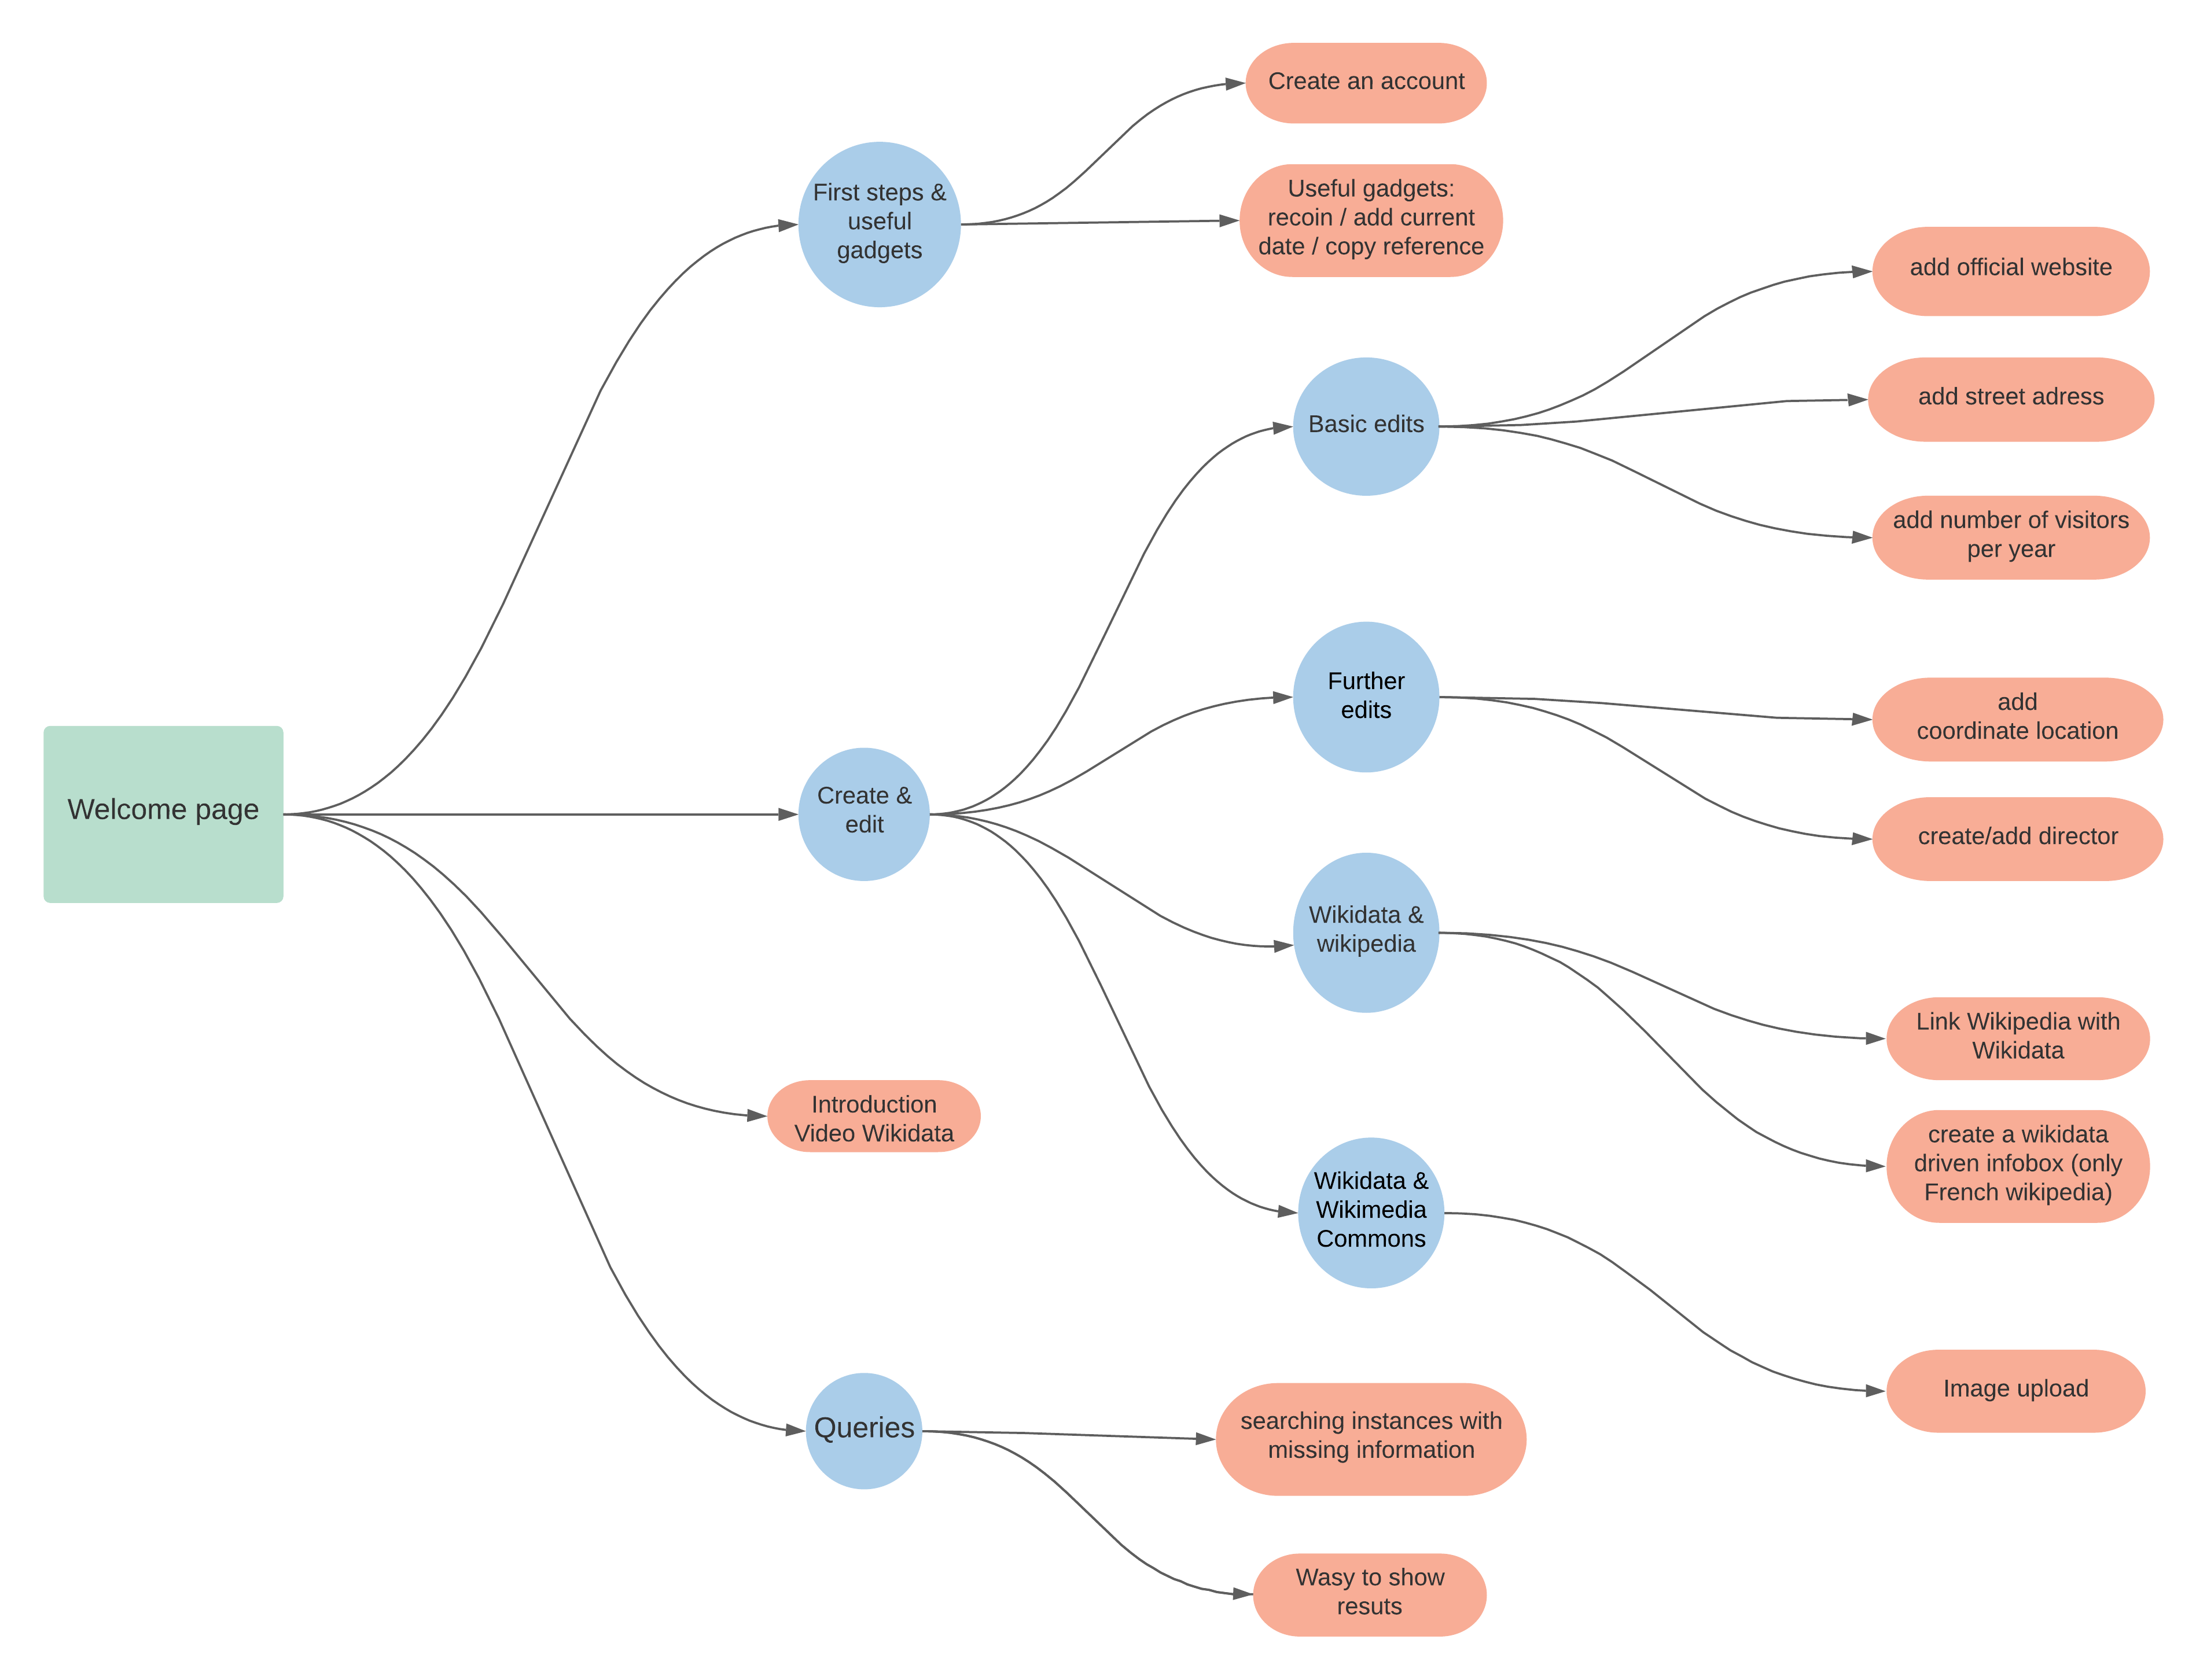
Our Hackathon project consists in producing a website with Wikidata tutorials specifically aimed at heritage institutions. The tutorials shall cover a broad range of topics, providing simple explanations for beginners in several languages. The tutorials will be gathered on a website, where users can either look for specific instructions or go through the whole programme of tutorials. In this perspective, we have created a storyboard going from a general introduction to the usefulness of Wikidata for GLAMs to tutorials explaining how to edit specific information.
The tutorials are based on powerpoint presentations with audio tracks. We have prepared a template to facilitate the tutorial production during the hackathon. We also have scripts for some of the topics. We will be using applications such as deepl to automatically translate the scripts. With the use of “text to speech” converters, we will record the scripts in English, French, German and Italian. This will allow us to produce many tutorials in the short time span of the GLAMhack.
A second aspect of our project consists in producing a short video as an introduction to our website. This video should explain what kind of information is registered about GLAMs in Wikidata and what benefits the institutions can draw from the database.
We are looking for participants who are interested in sharing their Wikidata knowledge, people who have experience with fun and easy tutorials, people who know wordpress to work on the website, polyglots who can edit the automatically generated translations or people without any Wikidata know-how who want to help us develop the user journey of our tutorial programme by trying it out. For the short introduction video, we are looking for multimedia producers.
Making digitised scores audible
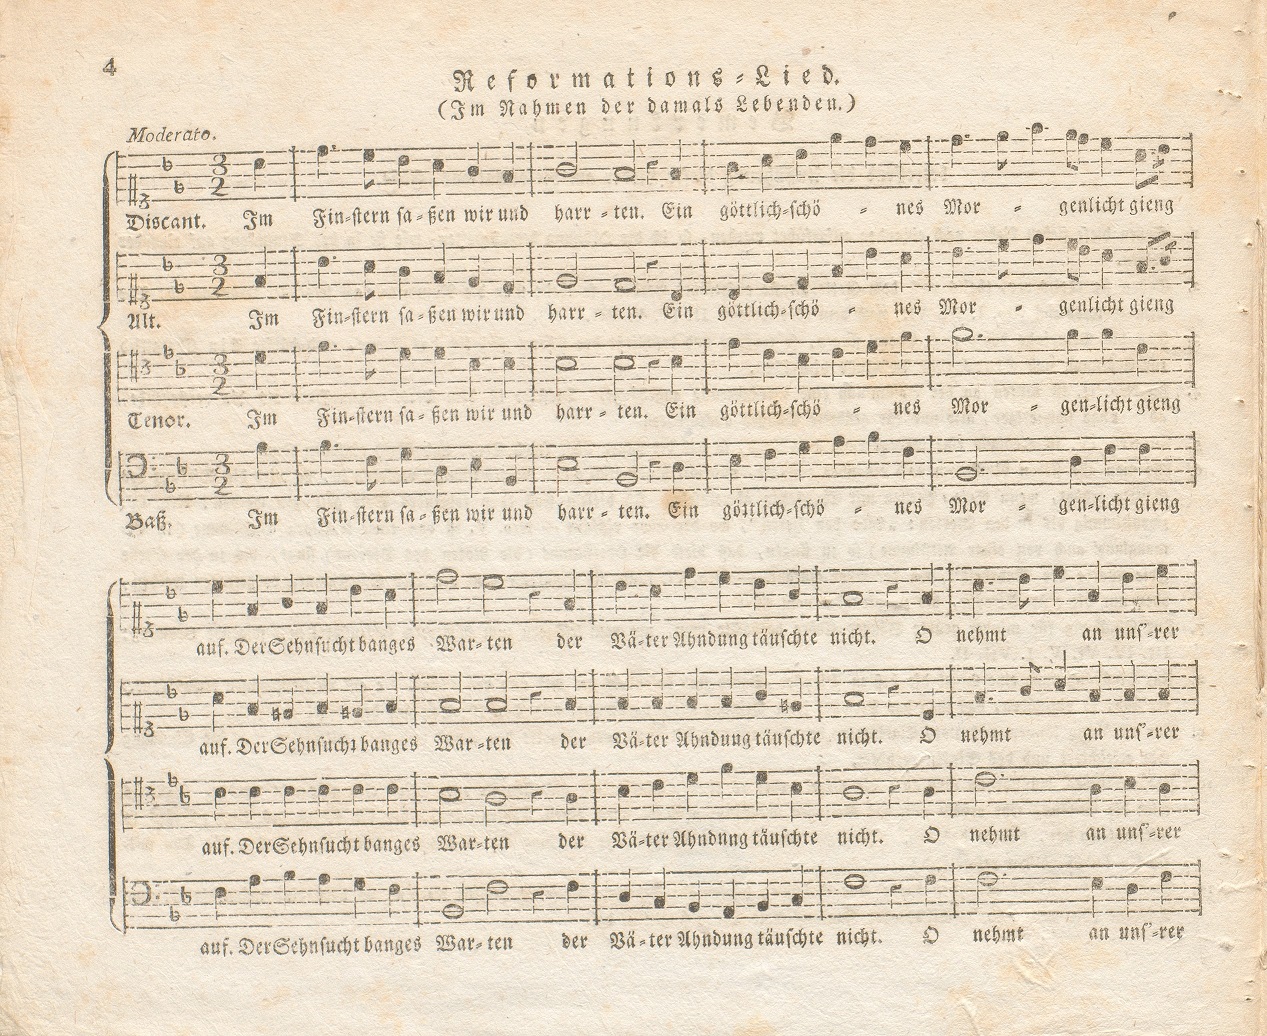
The Zentralbibliothek Zurich and several other Libraries in Switzerland own large numbers of music scores. Several of these scores are accessible via the digital platforms e-manuscripta and e-rara. But what if you want to hear the music instead of just seeing the score sheets?
We would like to make digitised music scores deposited on e-manuscripta and e-rara audible, using OMR and notational software. Our overall goal would be to develop a workflow resulting in audio files. Such a workflow would at any rate include manual steps. Rather than developing a fully automated pipeline, this little explorative study is an attempt to find out about the potentials of OMR in a cultural heritage context, possibly making written music more accessible.
Project Page
WikiCommons metadata analysis tool

The Image Archive of the ETH Library is the largest Swiss GLAM image provider. Since the ETH-Bibliothek went Open Data in March 2015, the image archive has uploaded 60,000 out of more than 500'000 images to Wikimedia Commons. The tool Pattypan is currently used for uploading.
On the image database E-Pics Image Archive Online, volunteers have been able to comment on all images since January 2016, thereby improving the metadata. And they do it very diligently. More than 20,000 comments are received annually in the image archive and are incorporated into the metadata (see also our blog "Crowdsourcing").
However, the metadata on Wikimedia Commons is not updated and is therefore sometimes outdated, imprecise or even incorrect. The effort for the image archive to (manually) match the metadata would simply be too great. A tool does not yet exist.
Challenge
A general GLAM analysis tool that compares the metadata of the source system of the GLAMs (e. g. E-Pics Image Archive Online) and Wikimedia Commons and lists the differences. The analysis tool could highlight the differences (analogous to version control in Wikipedia), the user would have to manually choose for each hit whether the metadata is overwritten or not. Affected metadata fields: Title, date, description, ...
Automatic "overwriting" of metadata (update tool) is against the Wikimedia philosophy and is therefore undesirable. Furthermore, it is also possible that Wikipedians have made corrections themselves, which are not recorded by the image archive.
Data
Bildarchiv Online, http://ba.e-pics.ethz.ch
Wikimedia Commons: https://commons.wikimedia.org/wiki/Category:Media_contributed_by_the_ETH...
Pattypan, Wikimedia Commons Upload Tool: https://commons.wikimedia.org/wiki/Commons:Pattypan
Blog Crowdsourcing: https://blogs.ethz.ch/crowdsourcing/
Culture In-Time 2

Simple event calendar for public viewing of performing arts productions past and future.
GLAMhack 2021 provided the opportunity to continue working on Culture inTime, a sandbox for adding and visualizing Performing Arts Production metadata in a simple calendar-like user interface. Culture inTime was first developed during GLAMhack 2020. A few features have been added: * Anyone with the right skills can now add their own SPARQL queries of existing linked open data (LOD) sources * Anyone can now configure their own Spotlights based on data sources in Culture inTime.
Culture inTime continues to put its focus on Performing Arts Productions. Go to https://culture-intime-2.herokuapp.com/ to try it out!
Types of Users
Power User: Can create SPARQL queries and Spotlights on data.
Spotlight Editor: Creates Spotlights on data.
Browser: Uses Search functionality and pre-configured Spotlights to peruse data.
Data Sources
In the section called Data Sources, power users can add their own SPARQL queries of existing linked open data (LOD) sources to Culture inTime. The only prerequisties are: * Technical expertise in creating SPARQL queries * Knowledge of the graph you want to query * Login credentials (open to all)
Two types of SPARQL queries can be added to Culture inTime * Queries to add names of Performing Arts Productions. These queries are limited to the performing arts production title and basic premiere information. * Queries to add supplementary data that augments specific productions. Supplementary data can be things like event dates, performers, related reviews and juxtaposed data (examples are indigenous territorial mappings, cultural funding statistics). Supplementary queries are loaded on the fly and always attached to one or more Performing Arts Production queries. To learn more about how to add queries, see the Technical Guide.
Different contributors are continuously adding and building on data sources. To see what's been added, go to https://culture-intime-2.herokuapp.com/data_sources.
Spotlights
Spotlights group together productions around a theme. They can span time, locations and data sources. Once you create a login, creating spotlights is easy with a new form that allows Spotlight Editors to choose their parameters and then share their spotlight with the community. Basic editorial functionality is available. To see some Spotlights, go to https://culture-intime-2.herokuapp.com/spotlights.
Technical Guide
To add Spolights or a new data source using SPARQL, please consult this Google Doc
GLAMHACK 2020
This 2020 GlamHack Challenge resulted from the discussions we had earlier this week during the workshops related to performing arts data and our goal is to create a Linked Open Data Ecosystem for the Performing Arts.
Some of us have been working on this for years, focusing mostly on data cleansing and data publication. Now, the time has come to shift our focus towards creating concrete applications that consume data from different sources. This will allow us to demonstrate the power of linked data and to start providing value to users. At the same time, it will allow us to tackle issues related to data modelling and data federation based on concrete use cases.
“Culture InTime” is one such application. It is a kind of universal cultural calendar, which allows us to put the Spotlight on areas and timespans where coherent sets of data have already been published as linked data. At the same time, the app fetches data from living data sources on the fly. And as more performing arts data is being added to these data sources, they will automatically show up. It can: - Provide a robust listing of arts and cultural events, both historical and current. Audiences are able to search for things they are interested in, learn more about performing arts productions and events, find new interests, et cetera. - Reduce duplication of work in area of data entry
The code is a simple as possible to demonstrate the potential of using LOD (structured data) to create a calendar for arts and cultural events that is generated from data in Wikidata and the Artsdata.ca knowledge graph.
The user interface is designed to allow visitors to search for events. They can: - Use the Spotlight feature to quickly view events grouped by theme. - Use Time Period buttons to search a time period. - Use a Search field to enter a search using the following criteria: name of production, theatre, city, or country. - Visit the source of the data to learn more (in the example of an Artsdata.ca event, Click Visit Event Webpage to be redirected to the Arts Organization website.
Note: Currently when you enter a location, data only exists for Switzerland and Canada (country), Zurich, Montreal/Laval/Toronto/Vancouver/Fredericton and some small villages in Quebec.
Search results list events sorted by date.
Challenges
Data is modelled differently in Wikidata, Artsdata, and even between projects within the same database. Data has very few images.
Deploy Looted-Art Detector
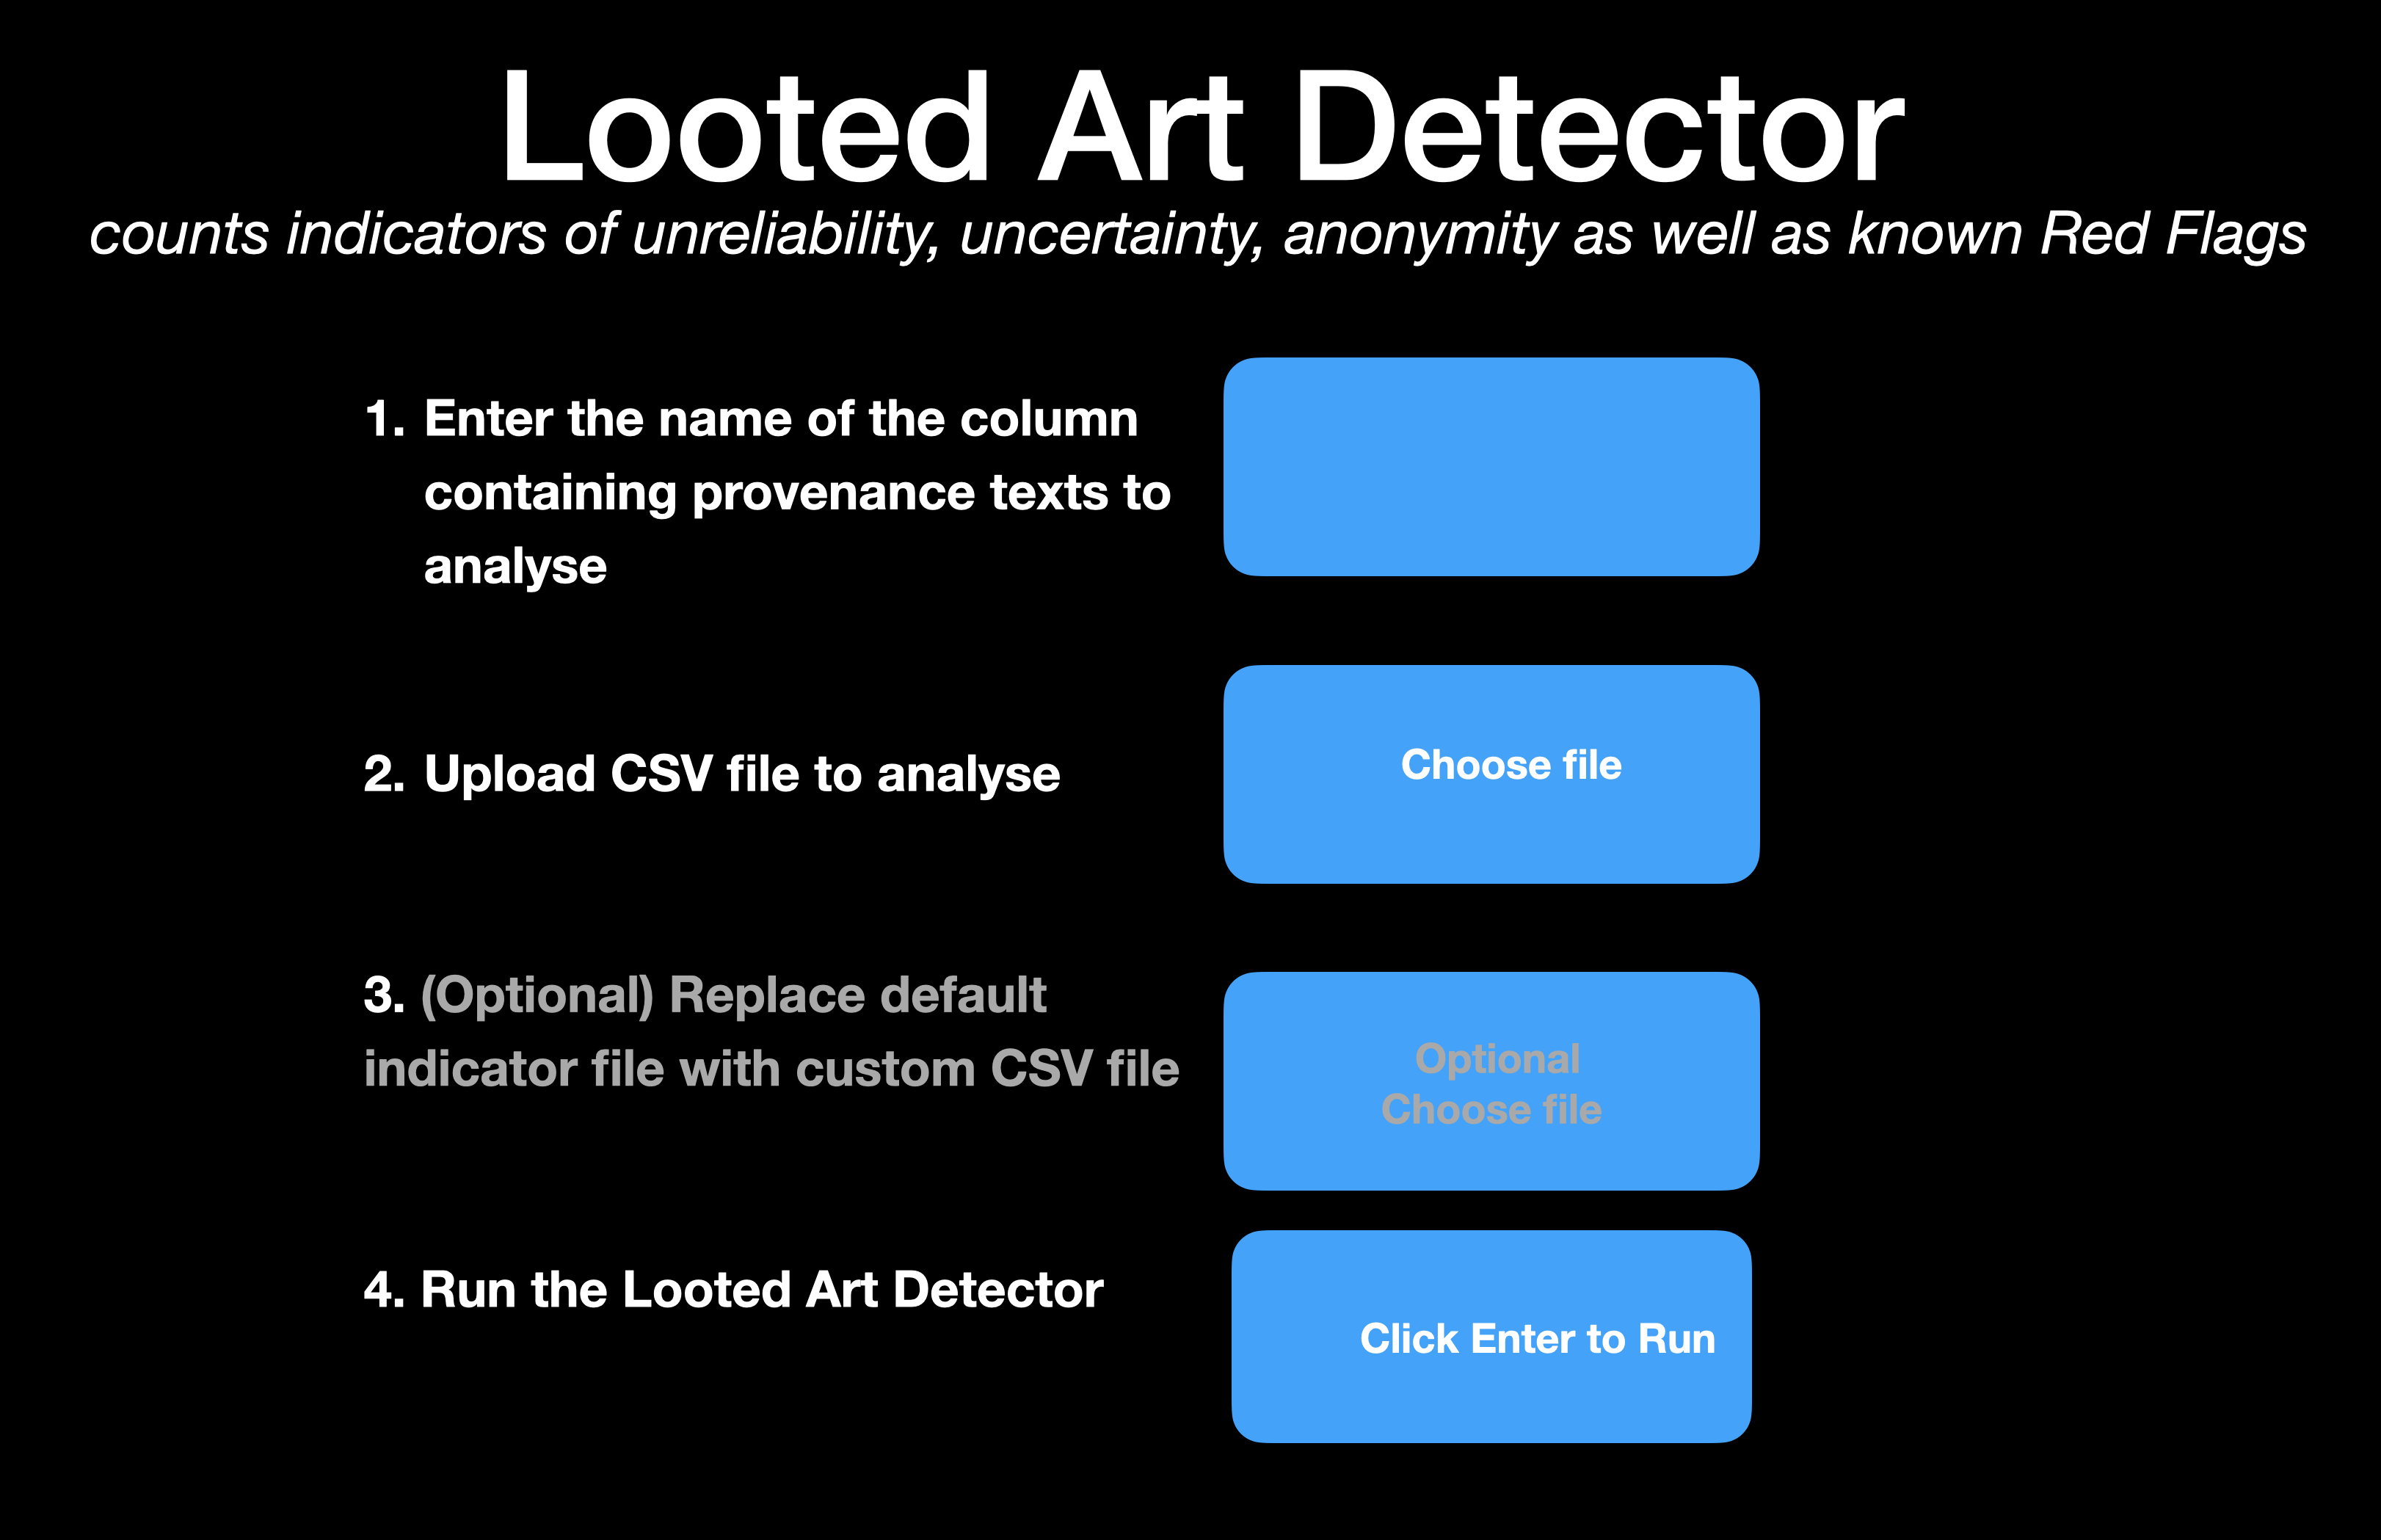
Make it easy for anyone to use the Looted-art Detector we created at last year's Glamhack2020
The goal is to create an easy-to-use online tool that analyses provenance texts for key indicators: UNCERTAINTY, UNRELIABILITY, ANONYMITY and RED FLAG.
The user uploads the file to analyse, and the tool enhances the file with quantitative information about the provenance texts.
Try it out! https://artdata.pythonanywhere.com
Nachtschicht 21 a 3D, Virtual Reality & Art Exhibition
We want to showcase the artworks of swiss contemporary artists in a VR space.
Nachtschicht21 is curating artworks of young swiss contemporary artists. During this hackathon we'd like to create beside the gallery exhibition, which will start on the 11.5.2021, a VR space, in which the works can be made accessible to everyone around the globe. This we plan to do with A Frame.
Data to work with during the two days hackathon: https://drive.google.com/drive/folders/1_6AoAPutT2V7uh6ZE9W9S1OJwklS3KWF...
SoMe-channel of Nachtschicht 21 https://www.instagram.com/nachtschicht21/
The scene lives!

Opening a dataset of underground multimedia art
Create an open dataset of demoscene productions, which could be filtered to individual countries, themes, or platforms, and help make the demoscene more accessible to people who may have never heard about it. This dataset could be of interest from an art-history perspective to complement our UNESCO digital heritage application - or just be used to introduce people to the history of the 'scene.
This project is closely related to the Swiss Video Games Directory from previous OpenGLAM events, and was quite inspired by this tweet:
1/ First and most important: Is the scene dead?
Judging by the number of prods released each year, no! Naturally the pandemic in 2020 didn't help matters, but there is a solid average of 1300 Pouët-worthy prods each year! pic.twitter.com/9f5nJl2ATI— pouët.net (@pouetdotnet) January 1, 2021
Archived-Data-Diver
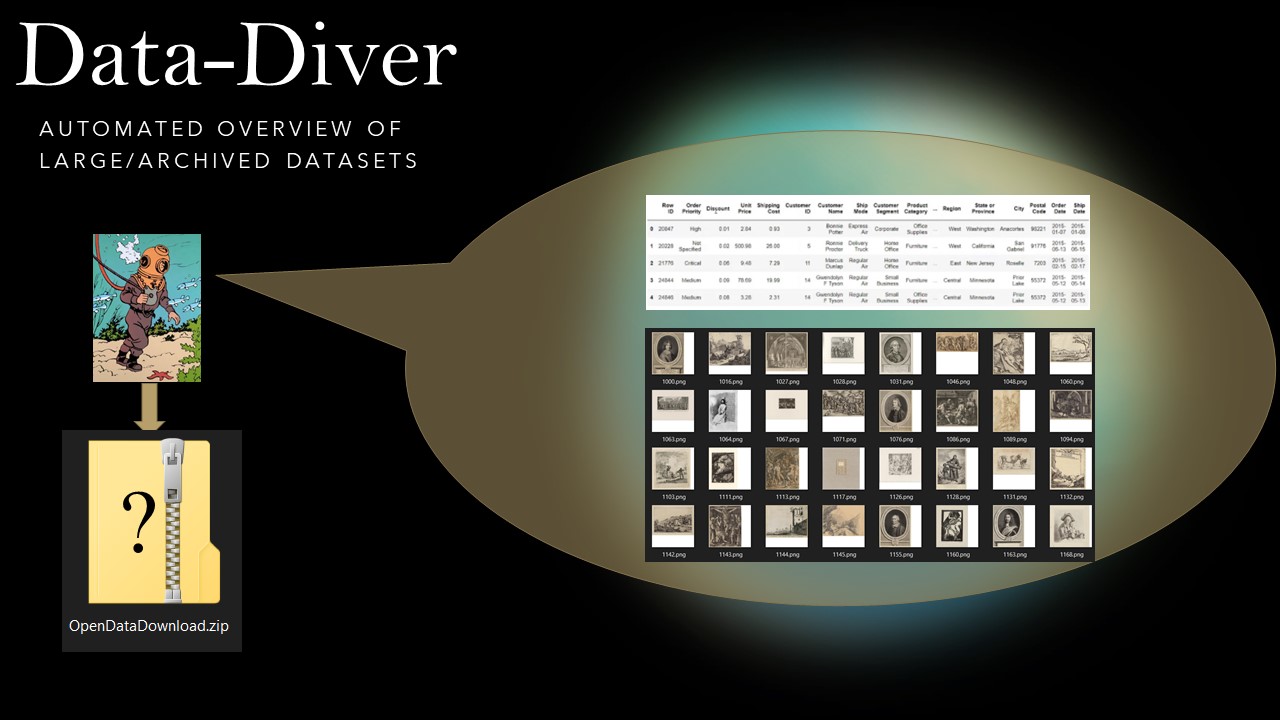
Automatically generate an overview of large archived datasets
Finding and viewing open datasets can be time consuming. Datasets can take a long time to download, and after exploring them you realise it is not in the form you needed.
The idea is to create a tool that could run on open data providers' servers, but also on a local computer, which automatically generates an overview of the files, images and along with some summary statistics.
Fonoteca Jukebox

An innovative way for visitors of the Swiss National Sound Archive to listen to the 500+ recordings of the Gramophone Collection
Living Herbarium
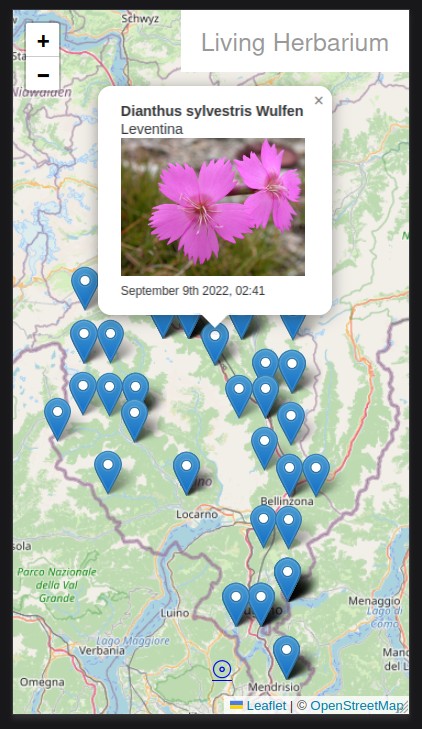
Connecting the Herbarium to Wikidata around playful experiences and storytelling
Mont

Mont is an AR webapp that lets you discover the hills and mountain tops around you.
Audio Analysis Challenge
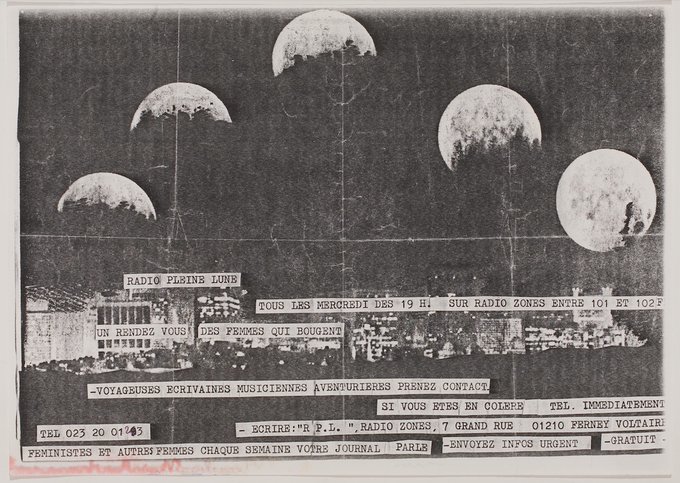
Retrieve as much information as possible from an audio collection, through various Machine Learning/Natural Language Processing methods
https://hack.glam.opendata.ch/project/132
Noon at the Museum

Despite excellent exhibitions about future foods and ecological diets: museum restaurants often disappoint. Let's change this together!
Mappa Letteraria
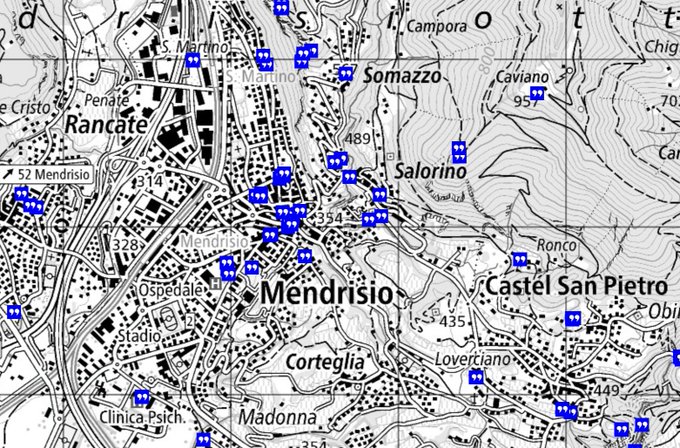
Paving the way for more open data in Tessin
Label Recognition for Herbarium

Search batches of herbarium images for text entries related to the collector, collection or field trip
Find my classical doppelgänger
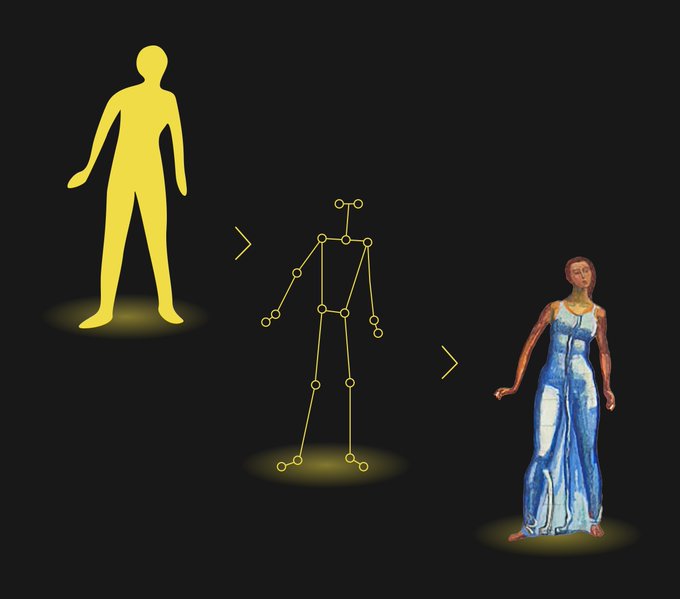
A website where a selfie can be uploaded and the closest classical portrait from the kunstmuseum basels archive will show up
Micro Bugs


