swissAR is an augmented reality web app displaying relevant information about the user's surroundings.
The Swiss portal for the historical sciences
Open Cultural Data Hackathon 2020
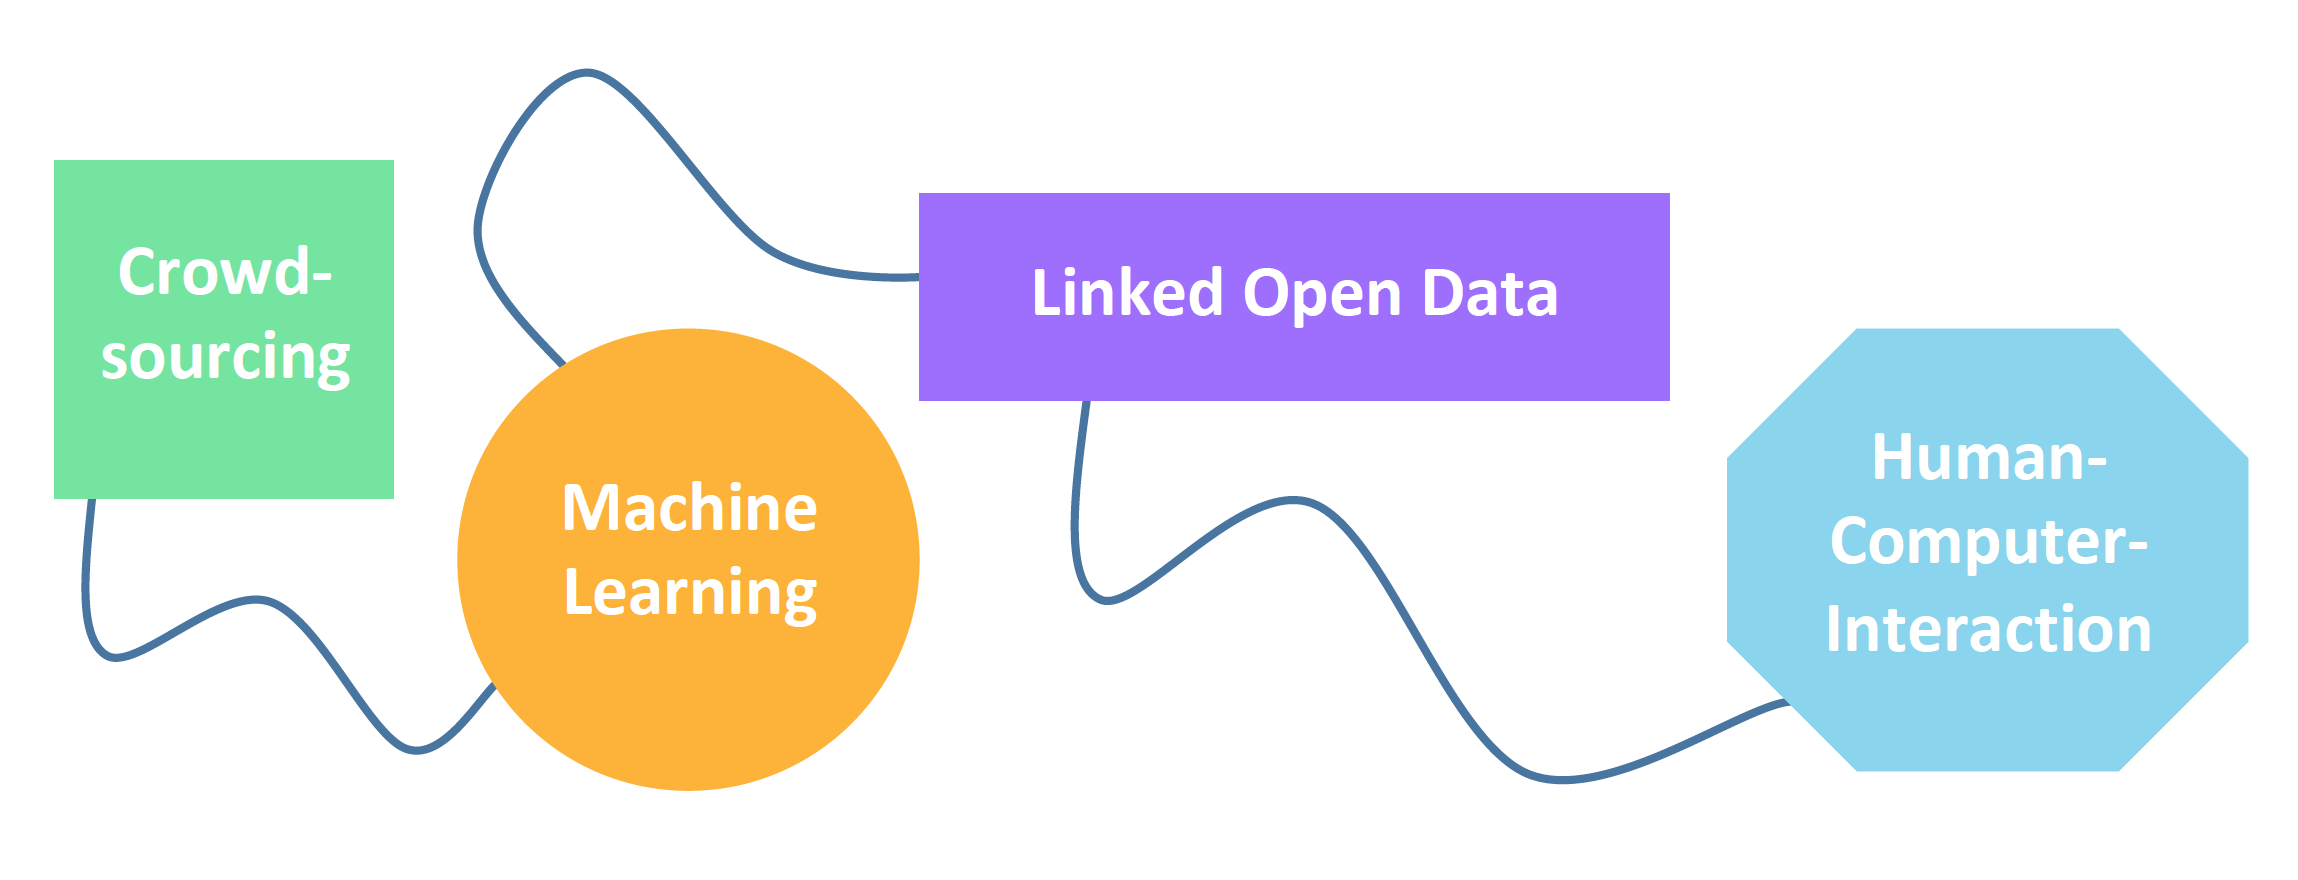
The 2020 Edition of the Swiss Open Cultural Data Hackathon took place on 5-6 June as an ONLINE hackathon. This edition is virtually hosted by the Swiss Institute for Information Science at the FHGR Chur, in collaboration with the Institute for Multimedia Production. The focus of the GLAMhack will lie on Linked Open Data, Machine Learning, Human-Computer-Interaction and Crowdsourcing. Once again, we are happy to collaborate with Wikimedia CH, infoclio.ch and other members of the Friends of OpenGLAM Network.
SwissAR

swissAR is a project based upon Toposwiss, a Virtual Reality model of Switzerland. swissAR is an Augmented Reality web app optimized for smartphones, allowing the user to get information about his surroundings (such as place names, peak and hilltop names, cultural heritage sites). Like Toposwiss, it is based on an open-data digital elevation model (DEM) published by the Swiss federal office of topography, as well as on toponymy databases listing Swiss city and village names, postcodes, mountain peaks, cultural heritage sites, bus and railway stations, sports facilities etc.
Instructions
 Launch your camera app, hold your smartphone upright and point it towards the QR code. Confirm website access, camera access, geolocation and motion sensor access. Hold still during calibration. As soon as swissAR displays the information you can turn around and discover any point of interest nearby.
In the center a compass will indicate your current heading by means of a compass needle and a degree indicator. The buttons at the bottom allow for adjusting the height of the virtual camera. Tap on the arrow-up button in order to lift the cam by 1000 meters or the arrow-down button to lower it respectively; on the bottom left a cam height indicator will display your current virtual height above ground level. Hit the reload button in order to recalibrate the app if needed.
Settings
To avoid the camera and locations confirm dialogs on startup you can adjust your smartphone settings.
- iOS Safari: Go to
Settings > Safari > Location Services > Allow
Settings > Safari > Camera > Allow - Android Chrome: Go to
Chrome > Settings > Location > Allowed
Chrome > Settings > Camera > Allowed
Technical
On startup swissAR will launch the camera, retrieve geolocation data, current compass heading and access motion sensor data. It will then process the elevation model in order to determine the user's height above sea level and any relevant point of interest within a given distance. swissAR will work anywhere in Switzerland; outside Switzerland it will take you to Berne (or any other place when using parameters, see below). swissAR does not store any kind of user or session data, neither on the device nor on the web server.
swissAR has been built by means of the Javascript framework A-Frame and the Augmented Reality component AR.js. A-Frame XR projects are rendered by any major web browser and on any platform. Yet, swissAR has been optimized for mobile use and will not work on desktop computers properly due to the lack of a rear camera or motion sensors.
Geography
In order to work properly, swissAR requires access to GPS by means of the HTML 5 geolocation API. The data output in the world geodetic format (decimal degrees) have to be converted into Swiss coordinates (zero point in Berne, see below). The Javascript processing is as follows:
navigator.geolocation.getCurrentPosition(function(position) { // HTML 5 geolocation API


   var n, e;


   var b1=position.coords.latitude∗3600; // conversion algorithm


   var l1=position.coords.longitude∗3600;


   var b2=(b1-169028.66)/10000;


   var l2=(l1-26782.5)/10000;


   n=200147.07+308807.95∗b2+3745.25∗Math.pow(l2,2)+76.63∗Math.pow(b2,2)+119.79∗Math.pow(b2,3)-194.56∗Math.pow(l2,2)∗b2;


   e=600072.37+211455.93∗l2-10938.51∗l2∗b2-0.36∗l2∗Math.pow(b2,2)-44.54∗Math.pow(l2,3);


}
The coordinates will then be rounded and matched against the DEM grid (further information on Wikipedia). Finally the scenery is aligned to the current compass heading which can be retrieved as follows (cross-platform solution):
window.addEventListener("deviceorientation", function(e) { // get current compass heading


   var heading;


   if (e.webkitCompassHeading) heading=e.webkitCompassHeading; // get webkit compass heading


   else heading=e.alpha; // get android compass heading


});
Parameters
swissAR is parametrizable in order to access locations other than the current one. Valid parameters are place names (case sensitive), postcodes or plain coordinates.
thomasweibel.ch/swissar(geolocation accepted) → current locationthomasweibel.ch/swissar(geolocation denied, or outside Switzerland) → zero point of the Swiss coordinate system (600 000 E/200 000 N) at the old observatory of the University of Bernethomasweibel.ch/swissar?ort=Chur→ Chur, Canton of Grisonsthomasweibel.ch/swissar?plz=8001→ Zurichthomasweibel.ch/swissar?lon=637071&lat=161752→ Wengen, Canton of Berne
Data
- opendata.swiss: Digital elevation model
- opendata.swiss: Place name and postcode database
- opendata.swiss: Toponymy database (further information by the Swiss federal office of topography)
Contact
6 June, 2020
Extra Moenia

COVID19 is restricting and changing the way we can access buildings and we can experience space. For safety reasons, access to museums and cultural sites is strictly regulated and complex.
Challenge: COVID19 is restricting and changing the way we can access buildings and we can experience space. For safety reasons, access to museums and cultural sites is strictly regulated and complex.
Vision: The outdoors represent a meaningful extension of museums and cultural sites. Connecting a building with the outdoors allows a different experience of the museum, its physical space and its collection.
Objective: Visualizing the ecosystem of connections of museums and cultural sites, by linking the building of the museum and cultural site to the outdoors. Combining data related to the collections to the original location of the objects, existing itineraries, potential venues, morphology of the territory, municipalities, mobility, infrastructure. Generating opportunities to create new itineraries (i.e. ethnographic, artistic, historical itineraries…) and new temporary exhibitions, dislocation of objects… We will focus on Ticino and on a series of examples.
Data available
Data we are currently uploading on openswiss.data
List of cultural operators in Ticino released by Osservatorio culturale del Cantone Ticino (DECS, Repubblica e Cantone Ticino) https://it.wikipedia.org/wiki/Wikipedia:Raduni/Prova_il_tasto_modifica/Elenco
Data on Val Piora released by the Cantonal Museum of Natural History of Lugano (rocks, flora, fauna, landscape, water)
Data on the Verzasca Valley released by the Museum of Val Verzasca (ethnographic itineraries, past exhibitions, museum collection)
Data on Leventina released Museum of Leventina (museum collection, past exhibitions)
Data on Neuralrope#1, permanent interactive installation at the pedestrian tunnel of Besso, Lugano, released by the municipality of Lugano (interaction of the public and daily passages).
We have already uploaded in 2018
On OpenStreetMap the repository made by the Osservatorio culturale del Cantone Ticino enriched with locations suggested by citizens
On Wikidata a selection of cultural institutions part of the repository made by Osservatorio culturale del Cantone Ticino
6 June, 2020
1914 - Newspapers at War

In this project, we are translating articles of two french-speaking newspapers from Switzerland from 1914 into German.
1914 was an interesting year not only because of the beginning of the First World War. The first cars clattered along unpaved dust roads, the first telephone lines crackled, trams drove through rapidly growing cities: Switzerland from the beginning of 1914 was dynamic and ambitious. But the war brought fear and uncertainty to the neutral country.
In our project we take a look at Switzerland in 1914, when Switzerland had 3.8 million inhabitants and life expectancy was around 54 years.
In addition, a rift between German- and French-speaking Swiss also developed during this period. After Germany's invasion of Belgium, many Belgians fled to France, from where they wanted to reach French-speaking Switzerland. Swiss who wanted to take in such refugees were asked to register with a private organization in Lausanne. Within a few weeks, hundreds of applications were received there.
This hospitality caused frowning in German-speaking Switzerland.
This was the beginning of a rift called the "Röstigraben" which still runs along the language border today.
On Opendata.swiss we found the data of two French-speaking Swiss newspapers from 1914. The data include articles of the year 1914 of the newspapers "Gazette de Lausanne" and "Tribune de Genève".
Our plan was to translate as many articles as possible into German using the Google Cloud Translation or the DeepL API. After some conception-work we decided not to use these APIs because we didn't need them. We wanted to focus only on a few articles of special events which can be translated manually. We thought it would be better only to publish relevant
The translated articles are being published on a website and are being enriched with similar articles from nowadays.
Link to the data: https://opendata.swiss/en/dataset/journal-de-geneve-gazette-de-lausanne-1914
Link to the prototype: https://glamhack2020.sandroanderes.ch/
6 June, 2020
Match with the Mountains

We'd like to introduce the best matching mountain according to the users needs.
In our project want to focus on the beauty of nature, that‘s why we decided to use the dataset «The Call of the Mountains».
Our aim is to generate an interactive map, which allows the user to quickly get an overview of the mountains around «Graubünden».
Frontpage (Map of Mountains)
-The map consists of several districts. After selecting one area, the user is able to see different suggestions - inside the selected district.
Subpage1 (Variety of Cards)
-After clicking the "See More"-button the user is directed to the first subpage.
-There will be shown a variety of different mountains - located in the chosen district and displayed as cards.
Subpage2 (Personal Choice)
-Once the user made his choice, he can get more details by using the "See Profile"-button.
-This leads to a second subsite, where the image of the selected mountain-card appears in full size
-Also more information about the background and location are visible.
Contact: Mirjam Rodehacke & Nicole Nett (students at FHGR)
Data Source: Fundaziun Capauliana
6 June, 2020
GLAM Inventory
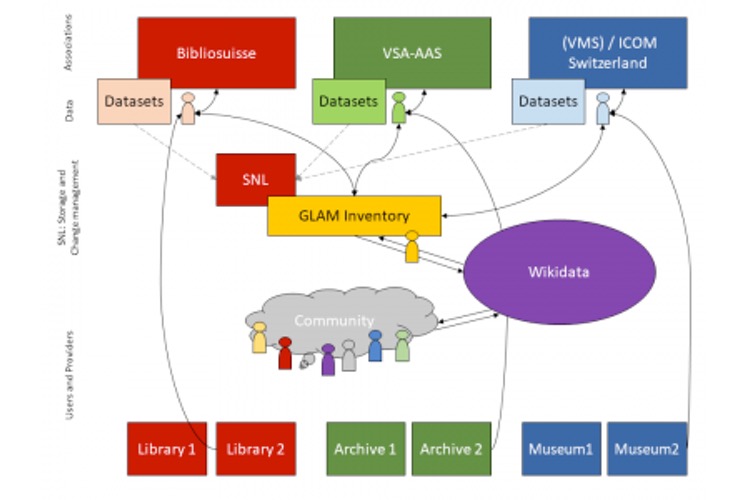
An inventory of all Swiss GLAM institutions.
Switzerland has a great ammount of libraries, archives and museums, but we are still missing a common directory of all these heritage institutions.
Challenge: The goal is to create a complete inventory of Swiss libraries, archives and museums and to find a solution for the data maintenance of this directory.
Vision: The "ideal" directory of Swiss GLAMs is up-to-date, complete, user-friendly, internationally compatible and structured. The contents are indexed and categorized, accessible to people and machine readable. Information about the collections and opening hours are included and a differentiated accessibility is ensured.
Scope: The directory could be used for the compilation of statistics, for research on collection holdings, institutions and/or events (research, reference works, tourism).
6 June, 2020
Culture in Time

Simple event calendar for public viewing that written in Rails, SParQl and Semantic UI (web interface platform).
Simple event calendar for public viewing that written in Rails, SParQl and Semantic UI (web interface platform). Using existing linked open data (LOD) on productions & events, locations & venues, and dates to feed contemporary and historical data into this calendar. Coming soon: LOD on artists and works.
Find information on this project in Glamhack Wiki and here.
Go to https://culture-intime.herokuapp.com/ and view calendar
Data Sources
Building on dataset already integrated into Wikidata: data from Schauspielehaus, Zurich. For reference see: https://www.wikidata.org/wiki/Wikidata:WikiProject_Performing_arts/Repor... Using data from Artsdata.ca: pan-Canadian knowledge graph for the performing arts
Background
The intention of this project was to two-fold: -Provide a robust listing of arts and cultural events, both historical and current. Audiences are able to search for things they are interested in, learn more about performing arts productions and events, find new interests, et cetera. - Reduce duplication of work in area of data entry
The code is a simple as possible to demonstrate the potential of using LOD (structured data) to create a calendar for arts and cultural events that is generated from data in Wikidata and the Artsdata.ca knowledge graph.
The user interface is designed to allow visitors to search for events. They can: - Use the Spotlight feature to quickly view events based on the following search criteria: name of city and predetermined date range. - Use Time Period buttons to search a time period (international). - Use a Search field to enter a search using the following criteria: name of production, city and country. - Select an image from a gallery to find related information.
Note: Currently when you enter a location, data only exists for Switzerland and Canada (country), Zurich or Montreal/Laval (city)
Search results list events sorted by date, title and location.
Challenges: Data is modelled differently in Wikidata, Artsdata, and even between projects within the same database. Data has very few images.
6 June, 2020
Interactive Storytelling Across Generations
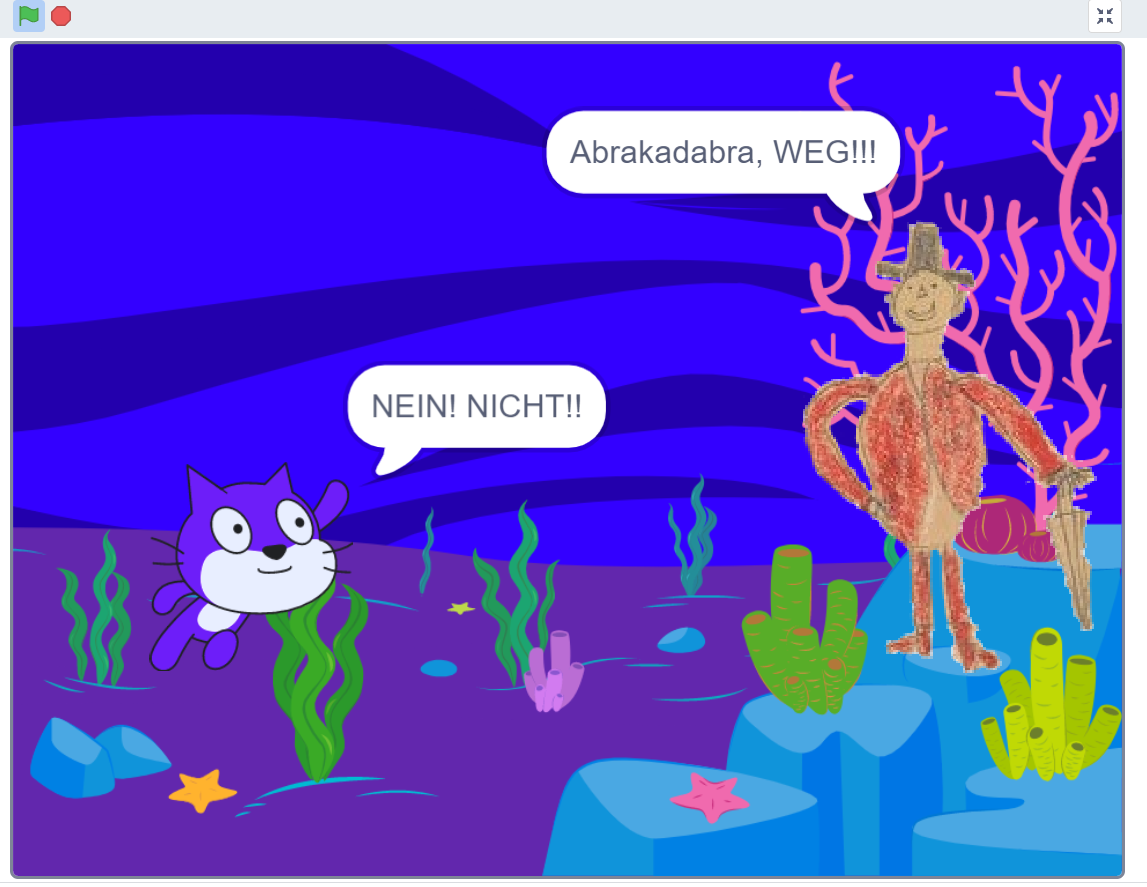
Developing digital learning in creative subjects
Developing digital learning in creative subjects by using paintings of childrens drawings or part of it of the collection Pestalozzianum.
We started with the question: How can we interact more with the people and maybe enrich the childrens drawings of the Pestalozzianum with more information?
3 cases are developed to make the web space of the collection more vivid, encourage children to interact and activate their fantasy.
Main challenge: How to learn effectively? (by the spirit of Pestalozzi)
Contact: Sylvia Petrovic-Majer (sylviainpublic@gmail.com)
6 June, 2020
Swiss Name Chart

We connect names out of a data set and integrate the data into a map of Switzerland or some other visual form of a map.
As we work for two days on this challenge, we've decided to determine, thanks to an open data set, the five most popular family names for the female and male population in 26 cities, in 26 cantons, in Switzerland.
We want to visualize this data on an interactive map which shows what family names are predominantly represented throughout the country.
We want to visualize this data on an interactive map which shows what family names are predominantly represented throughout the country.
An example is to find here: https://codepen.io/aomyers/pen/LWOwpR
We have not looked at the data set closely enough . it is always only the top 5 surnames per postal code. Sorted by woman and man. So we couldn't just say: These are the top 5 surnames per canton, because we would falsify the evaluation.
So we decided to simply choose one postcode per canton and selected the data in Google docs and then converted it into a Jason.
The goal is to create a One pager where you can see one city per canton, which is divided into top 5 men's last names and top 5 women's last names.
The dataset we used: https://opendata.swiss/de/dataset/nachnamen-pro-plz
First steps:
1. Some big cities in Switzerland are not mentioned. That means that the swiss post didn’t collect names there.
1. Some rangs are doubled because of the same number of names on the ranglist. Example: in Kloten are 35 surenames Mueller and 35 surenames Jäger -> so they show both as rang 5.
For our project we only can use one name. Jäger and not Mueller for example.
-
We made our own list. We had to find out wich is the next big city in the canton.
Check if there are double rangs and delete it if needed. -
After that, we converted the excel list to a json object. That json-list is now input of our javascript-file.
Next steps and problems:
4. We recognized, that we need should use a databank. This is unfortunately way out of our programm skillz and would take to much time.
5. RETHINK: How can we still manage that the lists appears?
6. SOLUTION, (thank you brain), -> its possible to show the list female and male on each side, with flexboxes. For that we need to make excel lists for each canton.
We’ve been working with atom and the integrated teleport package in order to be able to work together.. However, the team member who’s the owner of the files must always be online and always active, or else the invitees cannot access the files.
To be more precise: First of all, typed in a connection from the list in HTML to the pictures. They're changinge everytime they got hovered/unhovered. In a next step, we had to implement the .json, what wasn't easy because we didn't use a database so far in the reason of the time range. So we had to create a function, where the locations have to pass through our .json file. forEach() we used also to gather the gender and similar data out of JSON. Right after, we had to create a function for the table title. We had to create a function to read and parse the JSON:
function loadJSON(callback) {
var xobj = new XMLHttpRequest();
xobj.overrideMimeType("application/json");
xobj.open('GET', 'convertcsv.json', true);
xobj.onreadystatechange = function() {
console.log(xobj.readyState);
if (xobj.readyState == 4 && xobj.status == "200") {
// Required use of an anonymous callback as .open will NOT return a value but simply returns undefined in asynchronous mode
callback(xobj.responseText);
}
};
xobj.send(null);
}
This was the most important step to set it up without a database.
LEARNINGS:
We got the hint, that it's also possible to work on Github together and we'll definitely going to do that by the next project.
The programming was kept very easy, as we are only Newbies.
We made a map with pictures, every canton was one. For the hover we made an overlayer to color the canton red.
We connected it with a class to the right name button.
6 June, 2020
Art exhibitions, 1945-2020
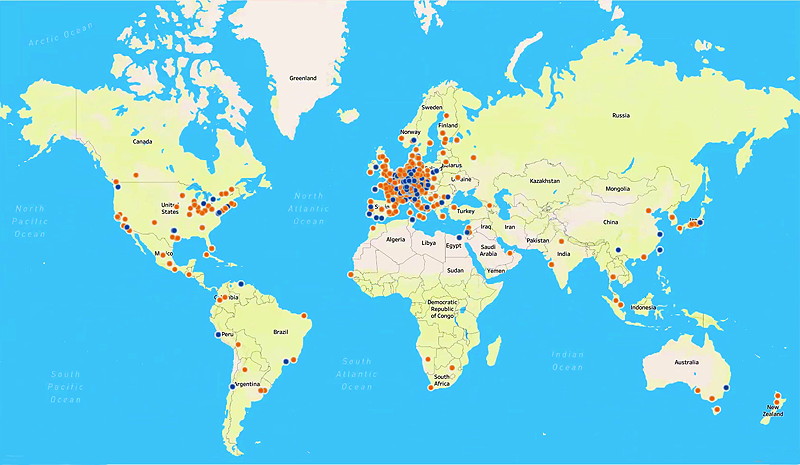
A user-friendly interface to visualize exhibition data from SIKART.ch on a map
Pitch
This project aims to create a friendly user interface to visualize and interact with a dataset of 50'000 exhibitions from SIKART.ch on a world map.
Description
This is a project realized by Ishan Mishra, using a dataset from the Swiss Institute for Art Research (SIK-ISEA) which contains about 50'000 art exhibitions from SIKART.ch, the online lexicon of SIK-ISEA documenting the activities of artists related to Switzerland, either through nationality or through sustained artistic activity in Switzerland.
Dataset
The dataset lists each of the 50'000 exhibitions title, start and end date, name of hosting institution, names of participating artists who are documented in SIKART, latitude and longitude data for the exhibition location and link to the respective exhibition entry in SIKART. The dataset is openly available in CSV format here:
https://drive.google.com/file/d/1dfqCHxai16hnkAXC_UCiU3b3J9EUHrTQ/view?usp=sharing
First draft
A first draft focused on visualizing the density of exhibition activity per year:
https://public.tableau.com/profile/ishan.mishra8696#!/vizhome/Artexhibitionsannually/ArtExhibtionsAnnually?publish=yes
Final version
The final result of the hackathon displays the exhibitions on a map and allows the user to filter exhibitions by start and end dates, by artist, and by type of exhibition. It also lists the amount of exhibitions per artist for the filtered result on a chart next to the map:
https://public.tableau.com/profile/ishan.mishra8696#!/vizhome/ArtExhibition1945-2020/ArtistDashboard?publish=yes
Note on final version and further development
Projects shown through the web version of Tableau Public respond quite slowly to user input like filter changes. The Tableau Public workbook can be downloaded at the above link and opened locally which makes the map much more responsive and also allows for changes to the workbook. Tableau Public was chosen as a freely available software to also allow for further work on the project by those who are interested. The dataset from the link above is also free to be used.
Technologies
Tableau Public, Open Refine, CSV
Contact
Ishan Mishra: ishanmisra200@gmail.com or https://github.com/SnickeyX
6 June, 2020
Detect Looted Art
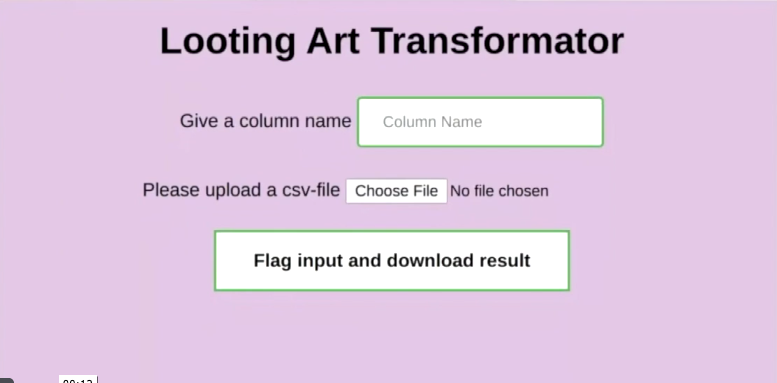
Help Automate Analysis, Flagging and Ranking of Museum Art Provenance Texts by the Probability of a Hidden History
The Question: How to sift through the millions of objects in museums to identify top priorities for intensive research by humans?
The Goal: Automatically Classify and Rank 70,000 art provenance texts by probability that further research will turn up a deliberately concealed history of looting, forced sale, theft or forgery.
The Challenge: Analyse texts quickly for Red Flags, quantify, detect patterns, classify, rank, and learn. Whatever it takes to produce a reliable list of top suspects
For this challenge several datasets will be provided.
1) DATASET:70,000 art provenance texts for analysis
2) DATASET: 1000 Red Flag Names
3) DATESET: 10 Key Words or Phrases
TRIAGE: You're the doctor and the texts are your patients! Who's in good health and who's sick? How sick? With what disease? What kind of tests and measurements can we perform on the texts to help us to reach a diagnosis? What kind of markers for should we look for? How to look for them?
6 June, 2020
Europa meets Europe

Art project that connects the Jupiter moon Europa with the continent Europe thru the help of APIs.
Description: In this art project, random images of the Galilean Moon Europe from the NASA archive are overlaid pixel by pixel with current images from European webcams in rhythm with the Jupiter Symphony by Mozart. The art project links and connects the continent of Europe with the 1610 by Galileo Galilei discovered Jupiter moon, which is around 660 million kilometers away. Each time the application is started it loads a new webcam image from Berlin, Rome, Paris, Oslo, Zürich or Chur and a new image from Europa. There is never the same combination.
Data: The dynamic images of Europe are accessed via the NASA API, the webcams via the Windy API. In the current version the music from Wikimedia Commons is directly loaded from the web server.
Technology: HTML, Javascript, P5.js and PHP
Current version: The current version achieves the goals set at the beginning of the GLAM hack 2020.
Future improvements: depending on the two dynamically loaded pictures the sizes are not equal. They have to be resized.
Main difficulty: At the beginning the error access to fetch at ... from origin ... has been blocked by CORS policy appeared when loading the NASA pictures with Javascript. The solution was to save to pictures dynamically to the web server with Javascript.
Contact: Martin Vollenweider
6 June, 2020
Georeferencing and linking digitized archival Documents
The PTT archive is increasingly digitising its collections with the aim of not only making documents more easily available, but also of making them accessible, linked and analysed in new ways.
The PTT archive is increasingly digitising its collections with the aim of not only making documents more easily available, but also of making them accessible, linked and analysed in new ways. Many of these Documents can be assigned to one or more geographical points. Three such records are presented below, with the idea of trying out new approaches and concepts:
Poststellenchroniken: This OpenRefine dataset contains an extract of the archive database with metadata on the post office chronicles stored in the PTT archive. The post office chronicles contain collected information, partly also newspaper clippings, photos and plans of all historical post offices of the PTT. The archive database entries for each dossier were prepared in OpenRefine, assigned to a post office (there are sometimes several dossiers per post office) and then linked to the corresponding current administrative communities on Wikidata via OpenRefine's Reconciliation Service. This linkage is currently not yet fully completed. The aim is firstly to record entries for the post offices on Wikidata itself, and secondly to enable a rough geo-referencing of the post offices via the link to the municipalities, which would otherwise only be possible via a time-consuming, manual re-listing.
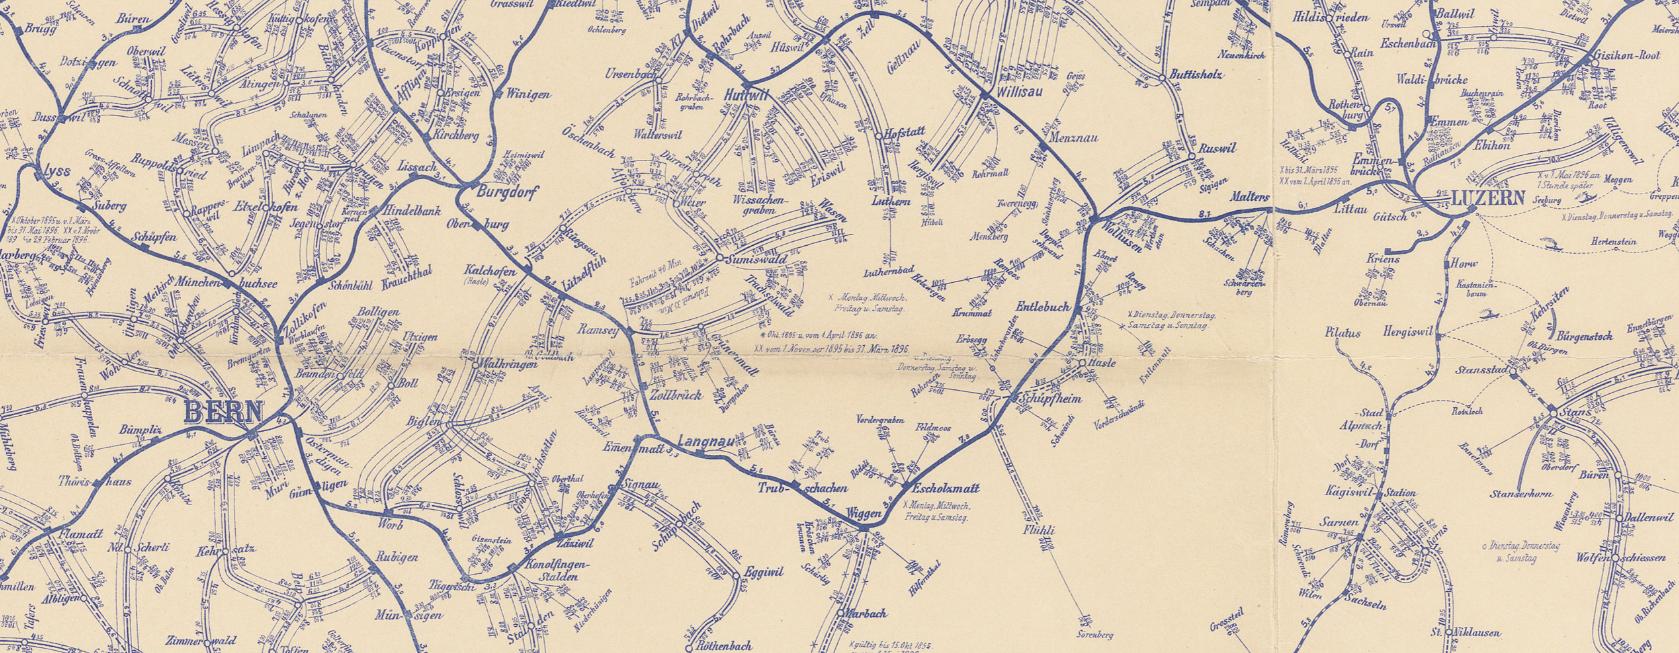
Postkurskarten: The dataset contains a selection of retro-digitized "Postkurskarten" of the Swiss PTT between 1851 and 1941, providing information on postal connections and the respective departure and arrival times. The older maps depict the entire network of postal connections (stage coaches and later also railway and post bus services), while the more recent maps are somewhat more schematic. The selection presented here gives an impression of the maps archived in the PTT archive. However, there is a large number of other maps (also on telecommunications) with a different geographical focus and covering the entire period of existence of the PTT. The file names correspond to the archive signature of the course charts.
The "Postkurskarten" are to be digitally annotated. Where possible, this should be done automatically (e.g. via text recognition) or via easy to use public collaborative tools. Maps prepared in this way could then be used for assigning/linking other archive documents on them geographically.
Postauto Postkarten: The data set contains a selection of retro-digitized postbus postcards from the PTT archive. These postcards each show Postbuses on known routes, especially pass lines. They were produced by the PTT for advertising purposes. Also here, possible methods for georeferencing shall be experimented with. These references can then be linked and localized with the annotated maps.
6 June, 2020
Graubünden Mountain Hunt
Try to find on old photos the places, where they were taken and recreate it.
MountainHunt is about providing geodata on old images. From a collection of 179 Pictures, that were taken between 1800 and 2000, you can choose one and try to find its origin. Them recreate it as good as you can and upload the new Version. On that way, we collect Geo-Data on the old Pictures. We crate a time-machine for everyone to join and experience.
6 June, 2020
Sir Dridbot Glamhacker
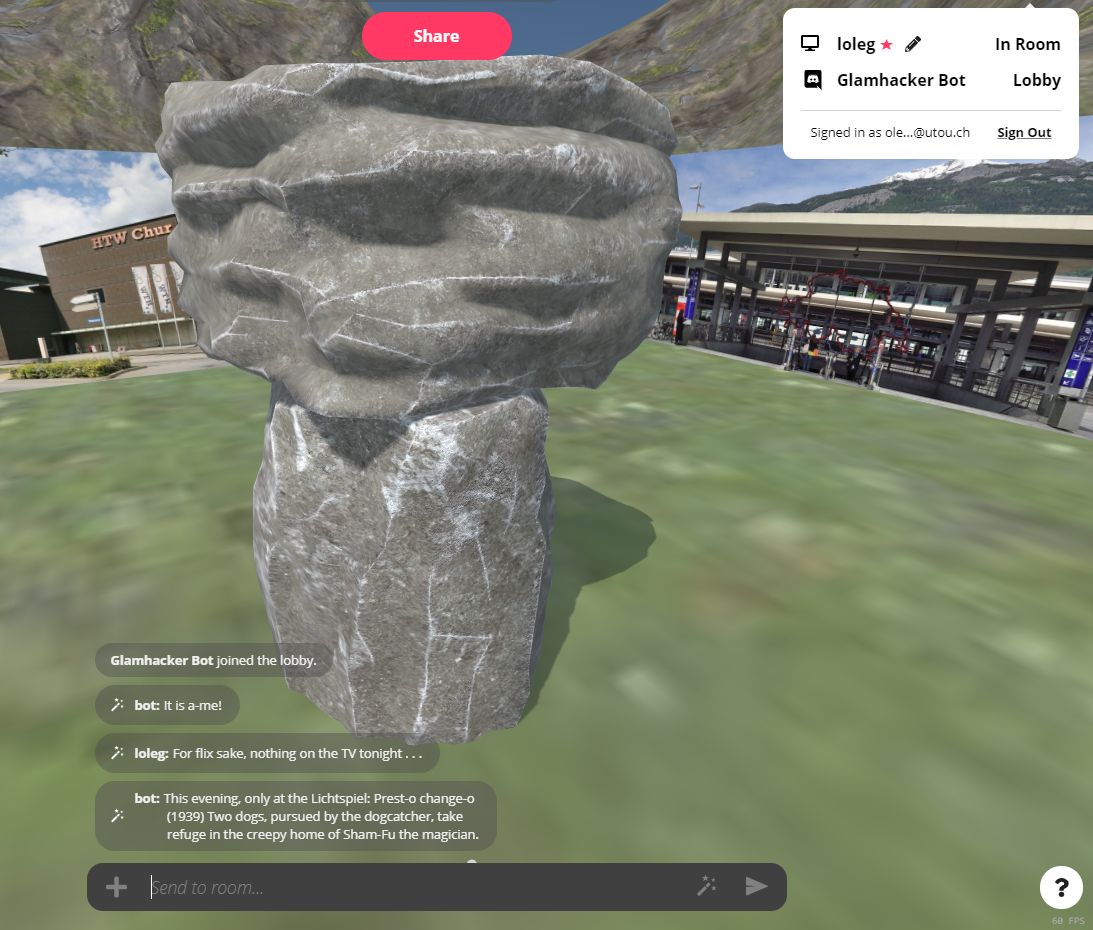
Surfacing archival open data with chatbots
We worked on ideas for enabling access to archive data using chatbots, which you can interact with right inside of the official chat platform of #GLAMhack2020. Details and screenshots are in the notebook.
6 June, 2020
«archives at» – Referencing Archival Fonds on Wikidata in a Semi-Automatic Way

2 June, 2020
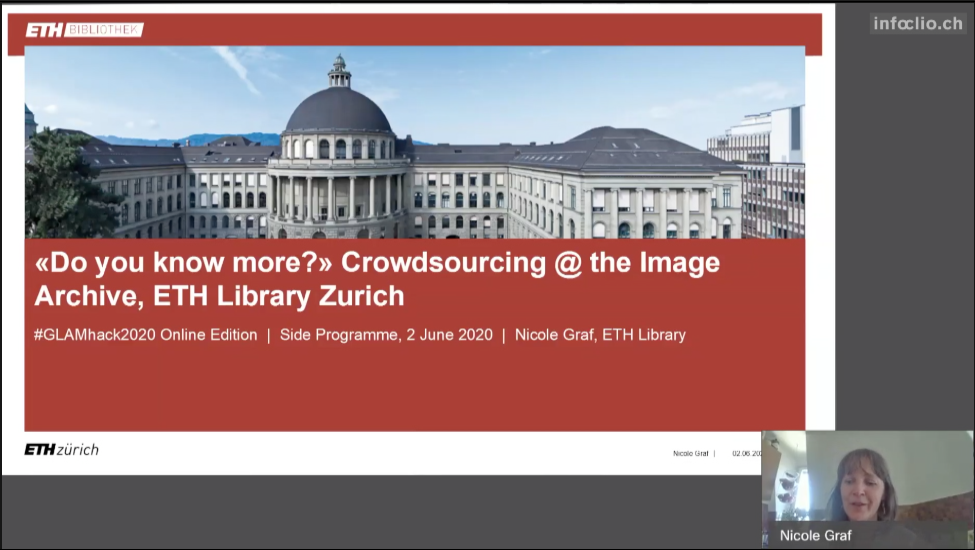
Do You Know More? Crowdsourcing @ the Image Archive, ETH Library Zurich
2 June, 2020
Does AI Perform Better? – Metadata Enhancement through Deep Learning by Christian Stuber and Manuel Kocher, students at Bern University of
2 June, 2020

Connecting Coins Around the Globe - Numismatics and Linked Open Data
5 June, 2020
Aftermovie

An insight into the GLAMhack20 for the broad audience by Till Minder, Demian Spescha and Oliver Julier
A Film by Till Minder, Demian Spescha and Oliver Julier
Each year, the GLAMhack brings to life fascinating projects created by fascinating people! Before the hackathon, the participants usually don't know what to expect. After the hackathon, their minds are full of inspiration, new ideas and good memories (at least we hope so).
People who have never been to a hackathon often find it very difficult to imagine what actually "happens" during the event and that usually represents an obstacle for them to make the big step and participate for the first time. This challenge wants to solve this situation by providing a aftermovie of the hackathon's atmosphere, of the teams and their interactions, of the projects and the processes involved towards their realisation.
Challenge: Create an aftermovie of the GLAMhack20! The aftermovie should be fun to watch and give an idea of the hackathon's essence to people who have never been to a GLAMhack.
6 June, 2020